Data quality assessment is a sample- and experiment-specific process. Here are some of the ways in which Xenium Explorer can help to check data quality.
Image
Inspect nuclei-stained (DAPI) image for tissue detachment or tears using the image options and projection settings.
Cells
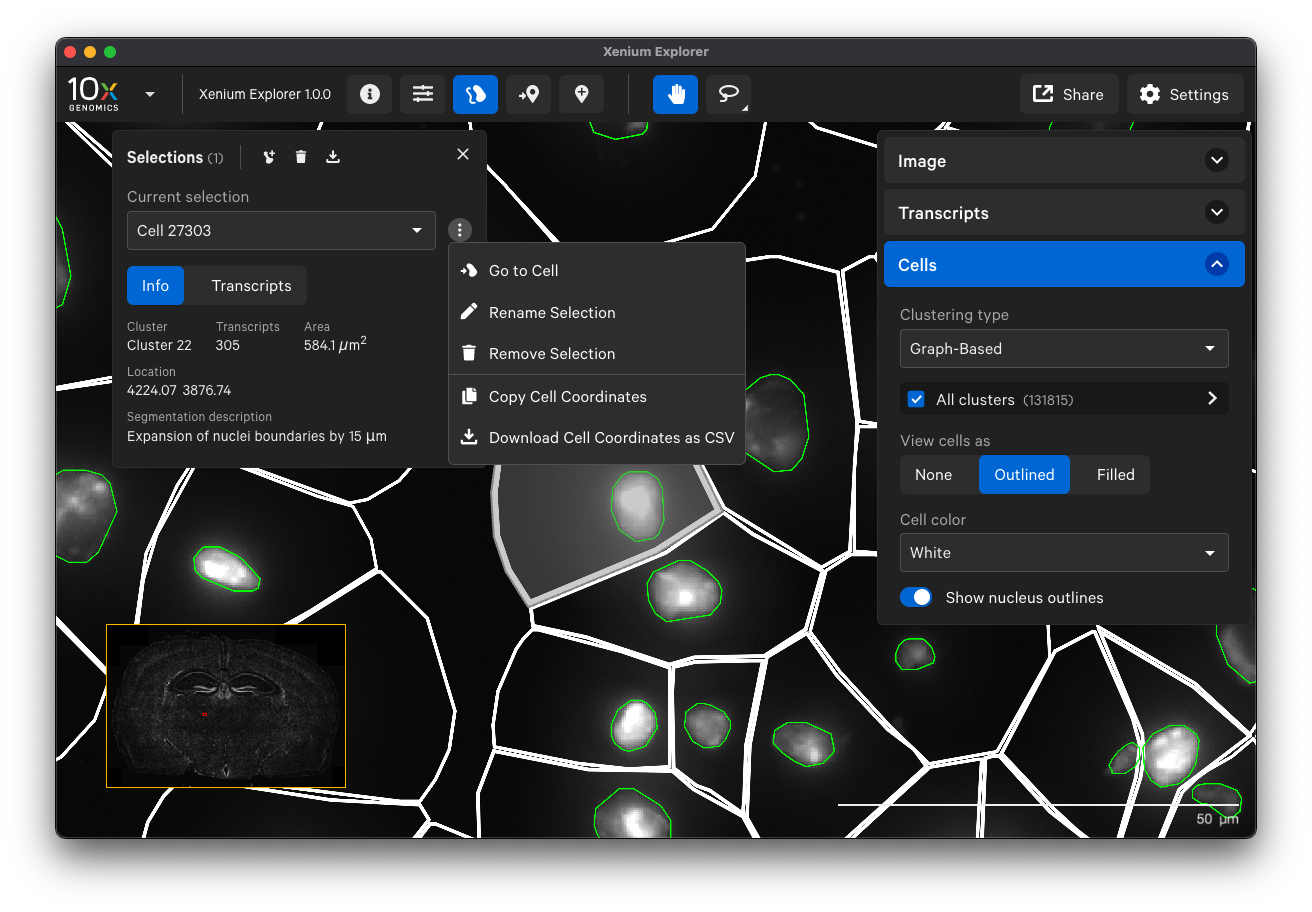
Examine cell segmentation with white cell boundaries and green nucleus boundaries to check cell segmentation quality. You can display or export information about poorly segmented cells by clicking on a specific cell or using the lasso tools to select a region of interest.
You can export cell IDs from Xenium Explorer and filter them out from the cell-feature matrix if you would like to remove some cells from downstream analysis. However, note that the cell segmentation polygon boundaries in Xenium Explorer are approximations for visualization performance, and the true segmentation mask results are in the cells.zarr.zip output file.

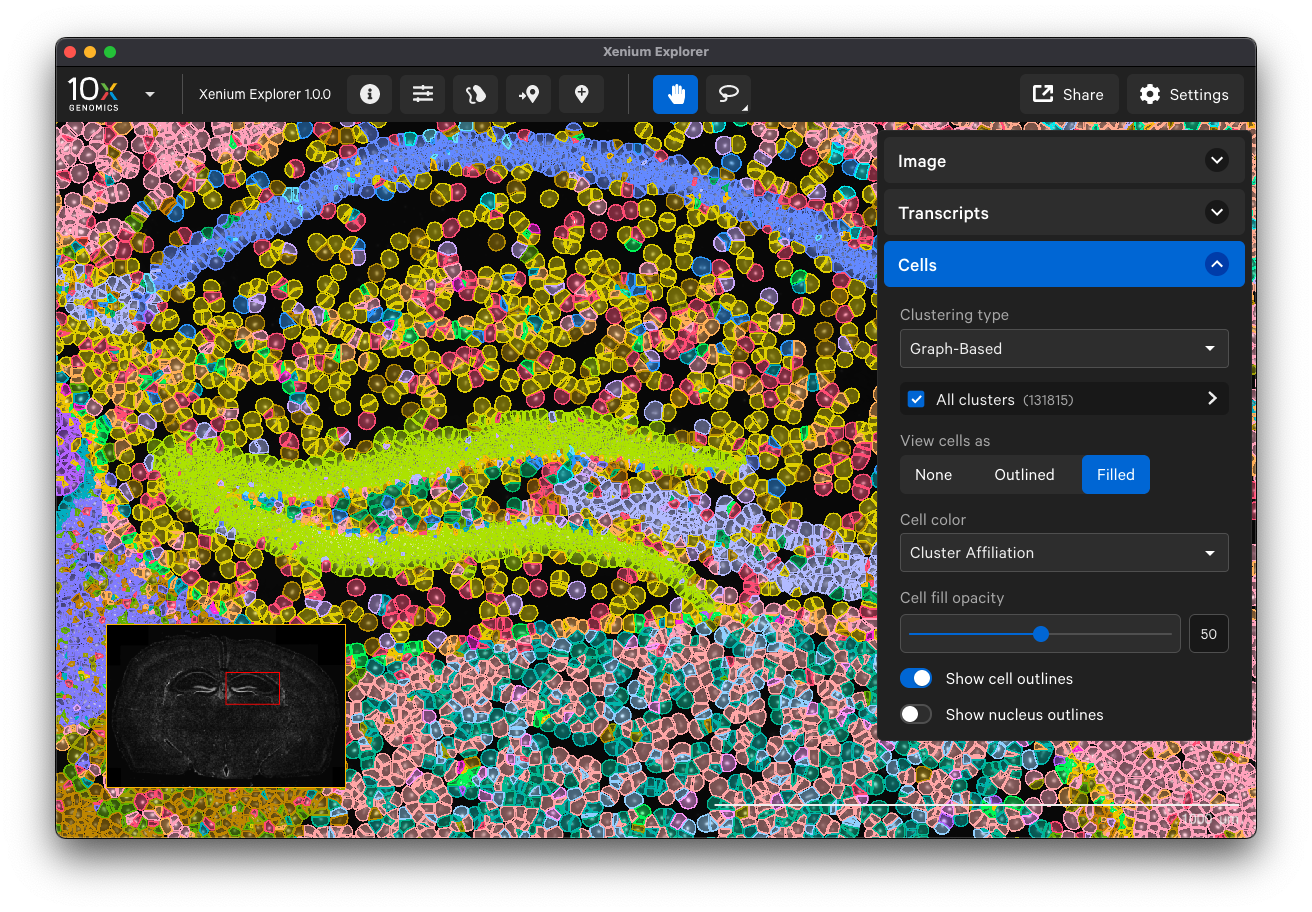
Examine cells colored by cluster affiliation to check whether clusters align with knowledge of the tissue type/state. Click on cells to check whether selected marker genes in cells match biological expectations.

Transcripts
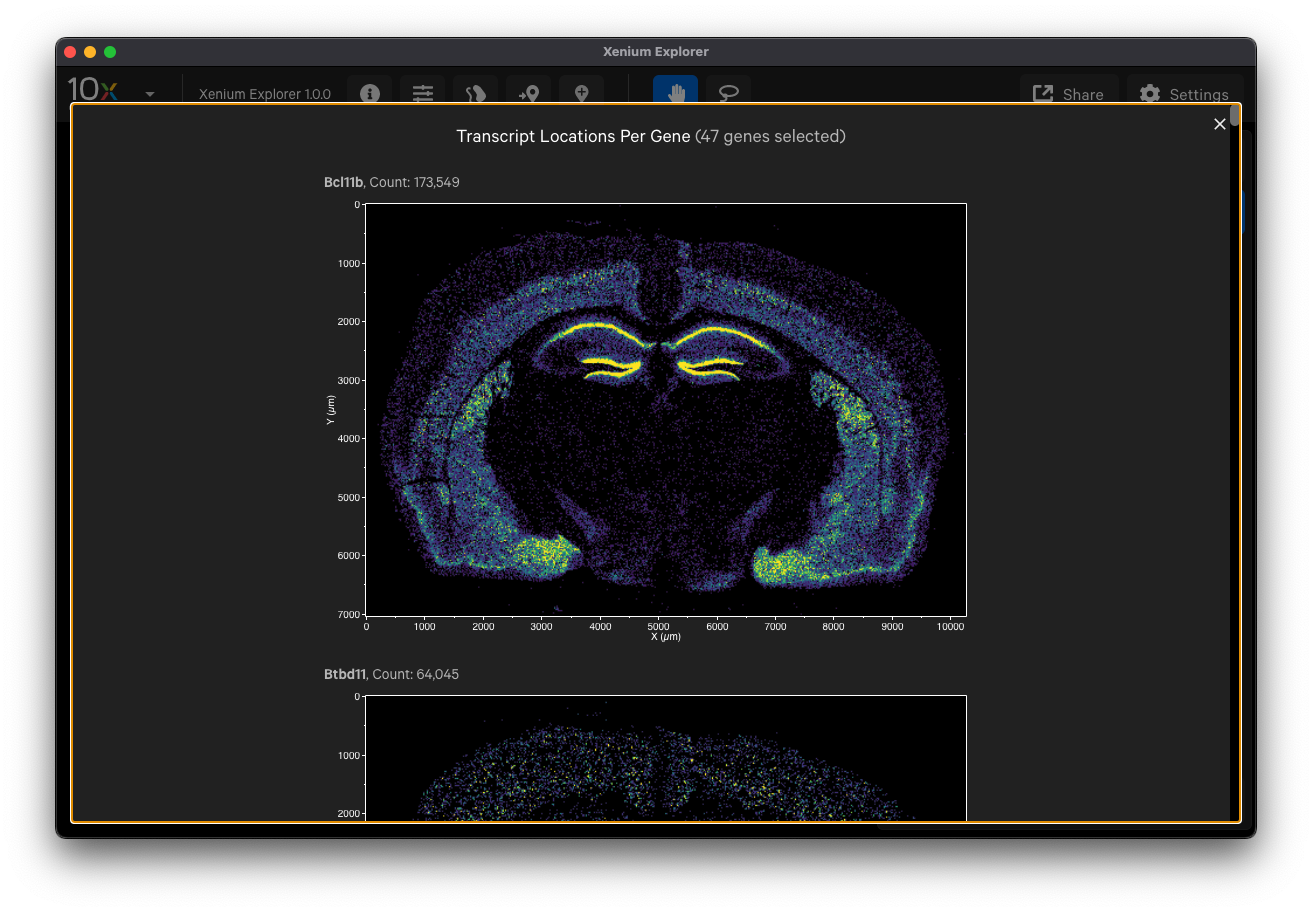
Here are some ways to validate the accuracy of your transcript data with genes that have known spatial or cell localization patterns:
- Select cell type marker genes and assess them using per-gene localization plots (Q-Score ≥ 20)

- Select a group of marker genes for a given cell type and view as different colored points to visualize separation between cells (i.e., to identify cell subtypes)
- View gene transcript patterns individually in the viewing area
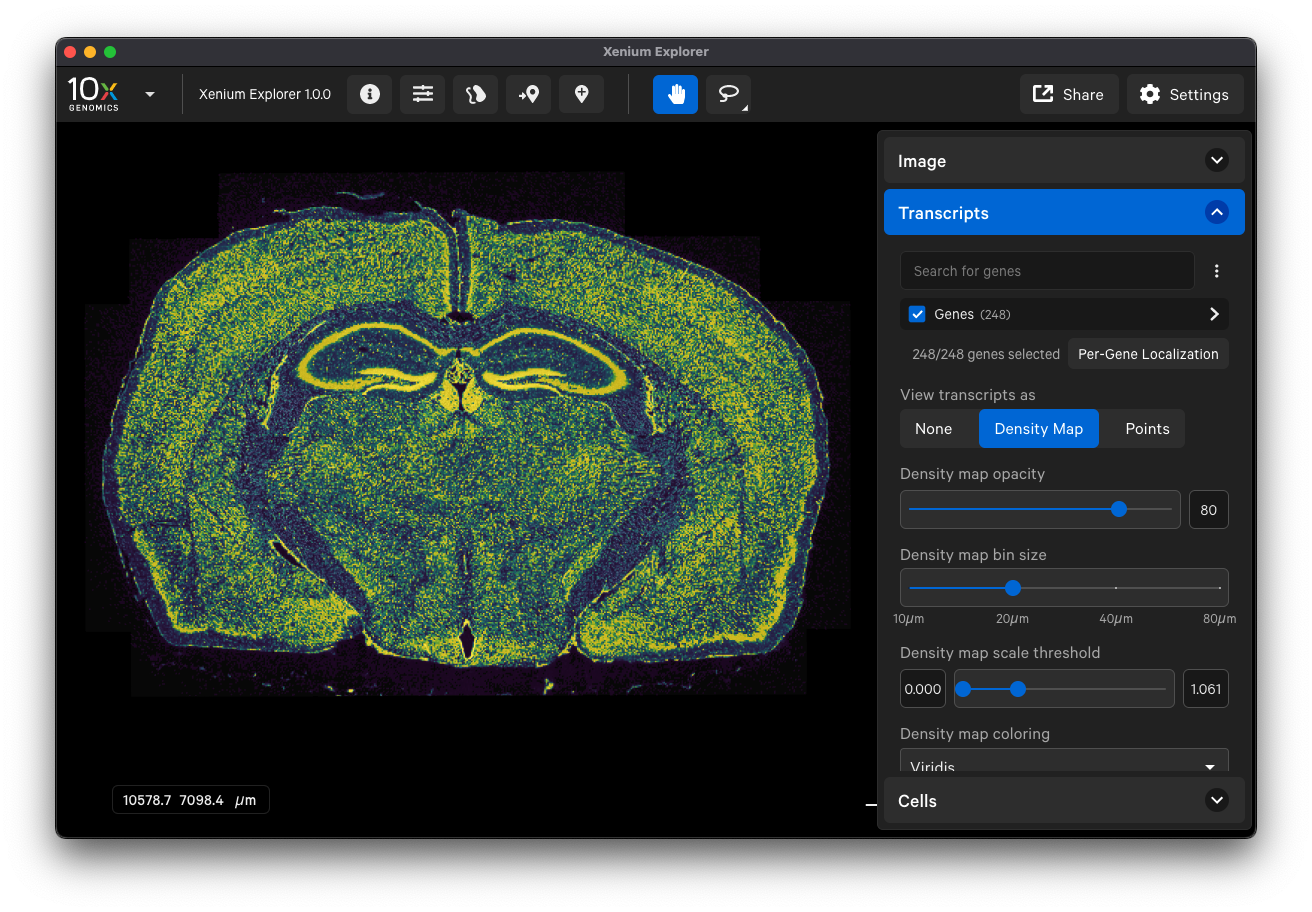
- View all gene transcripts as a density map across the entire sample to ensure uniform result

Contact support@10xgenomics.com for additional help.
