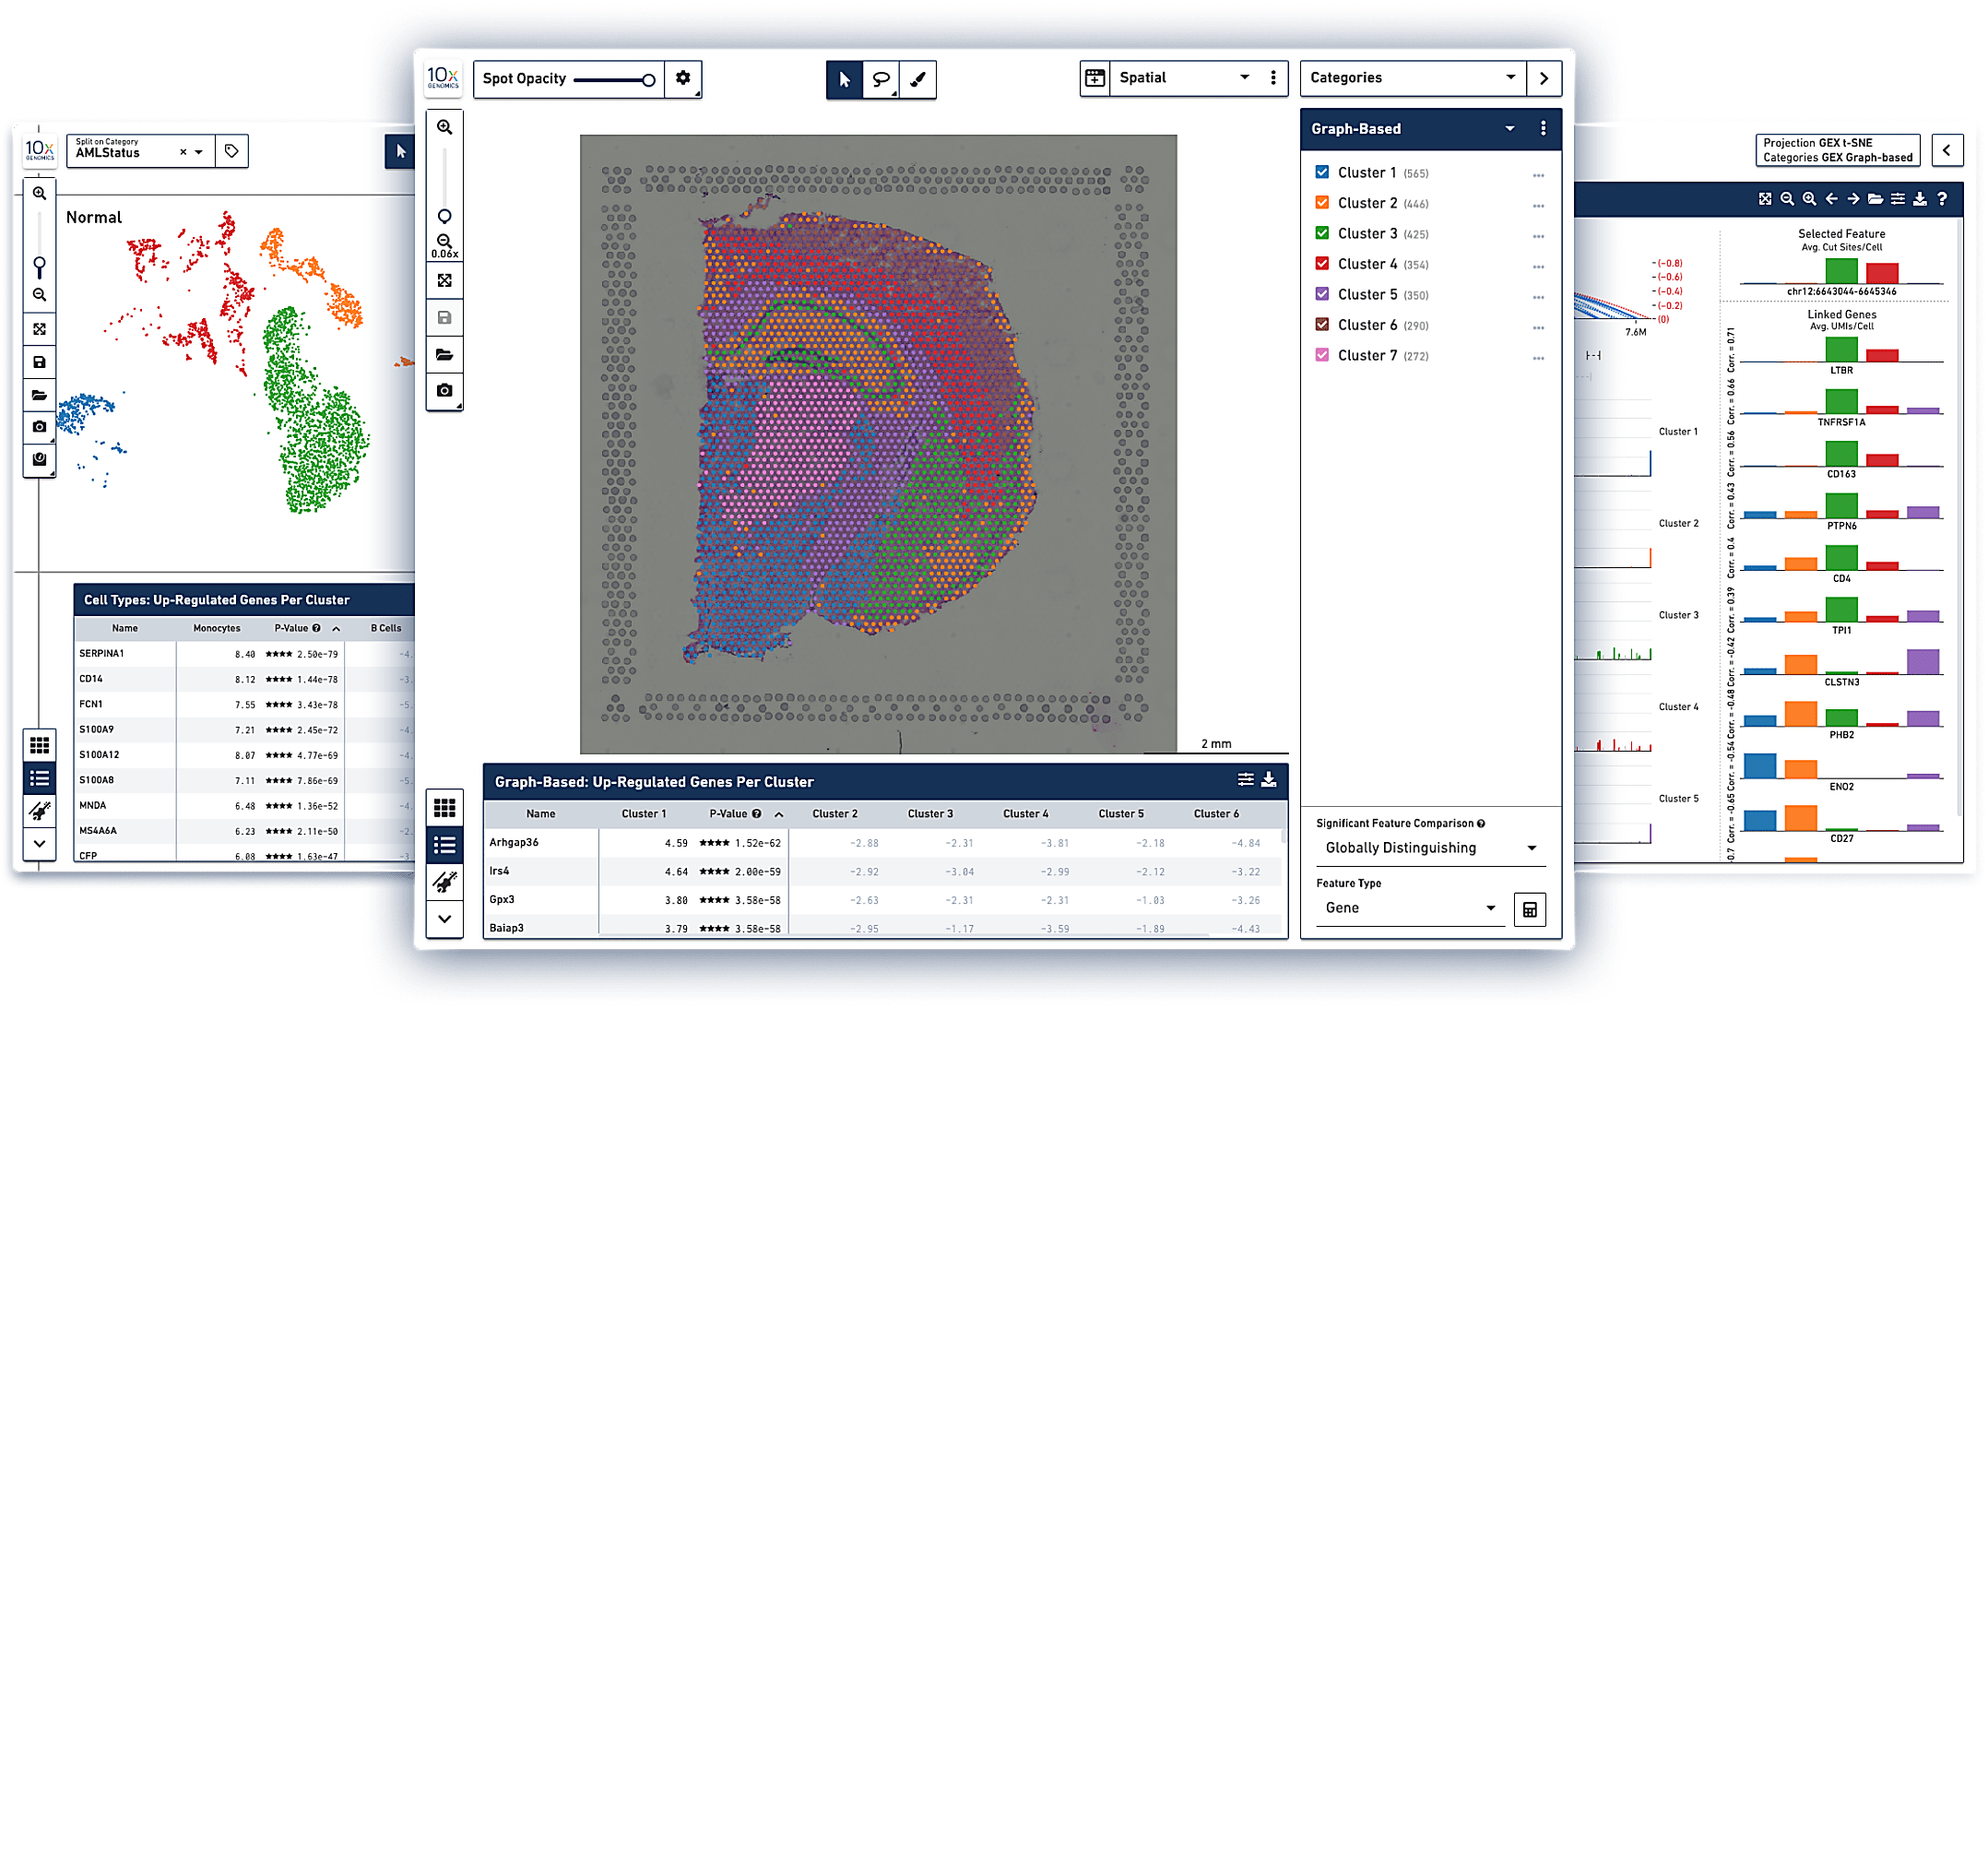
Help shape the future of data visualization
- Tell us what you want to see in Loupe Browser.
Multidimensional analysis
Interrogate different molecular readouts, within and across samples, to drive discovery.
Analysis with simple clicks
Explore data with this user-friendly interface to deepen your biological understanding.
Expert support
Leverage comprehensive software videos, tutorials, and more to accelerate your analysis.
Characterize cellular heterogeneity
Examine gene expression patterns
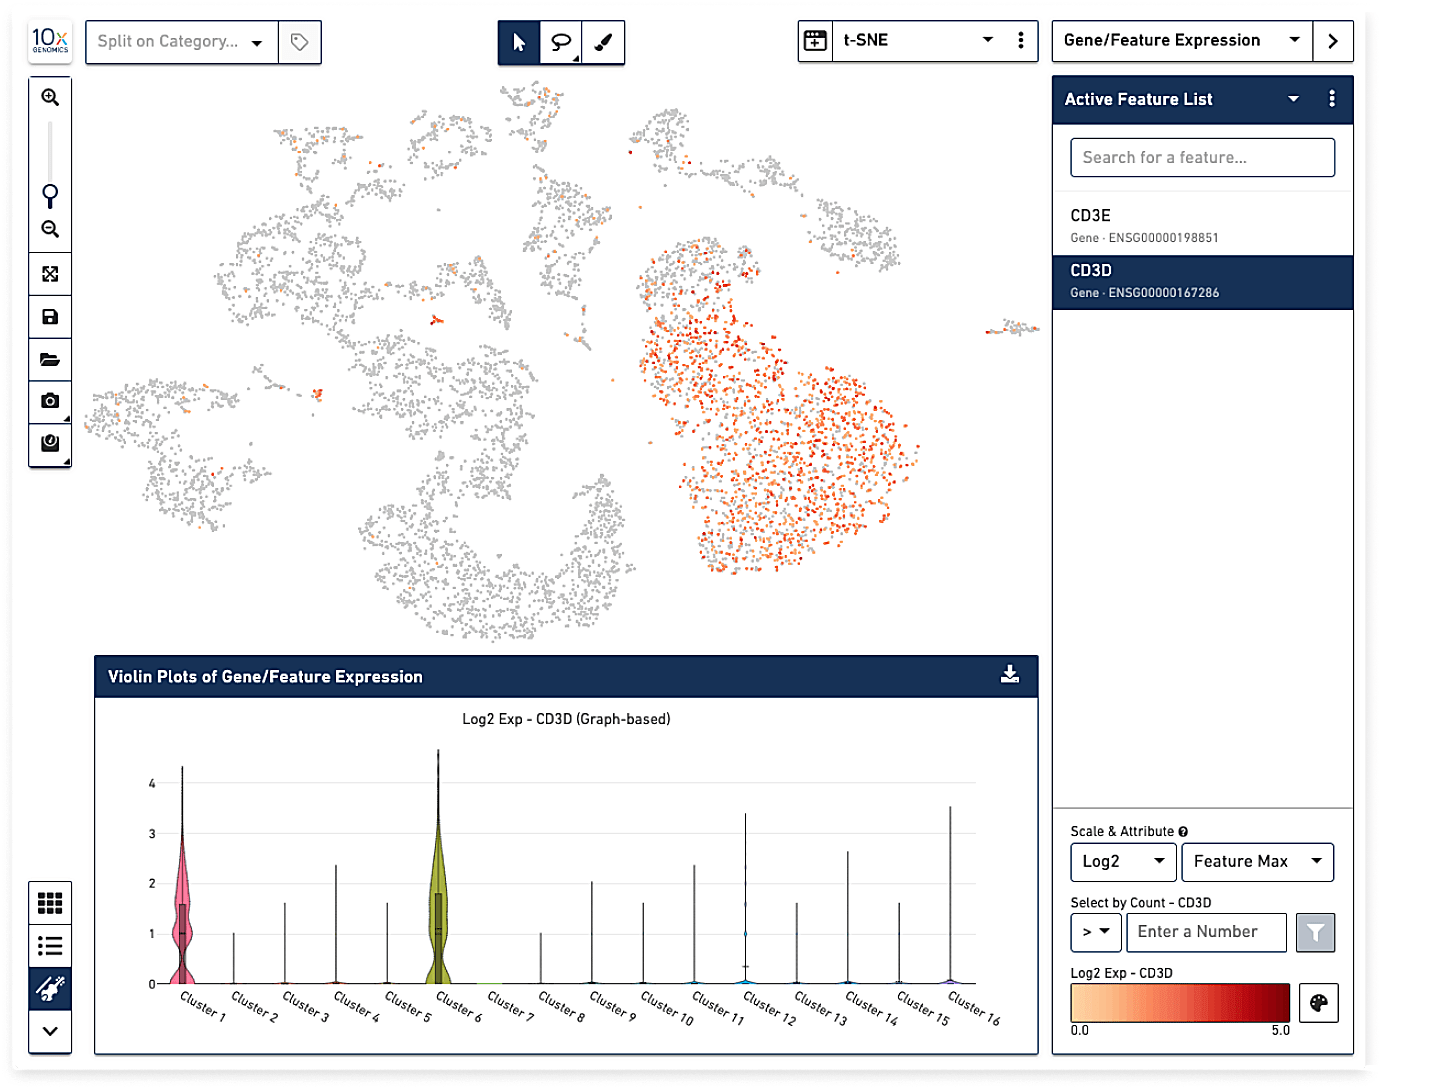
Visualize expression profiles and differentially expressed genes across cell clusters.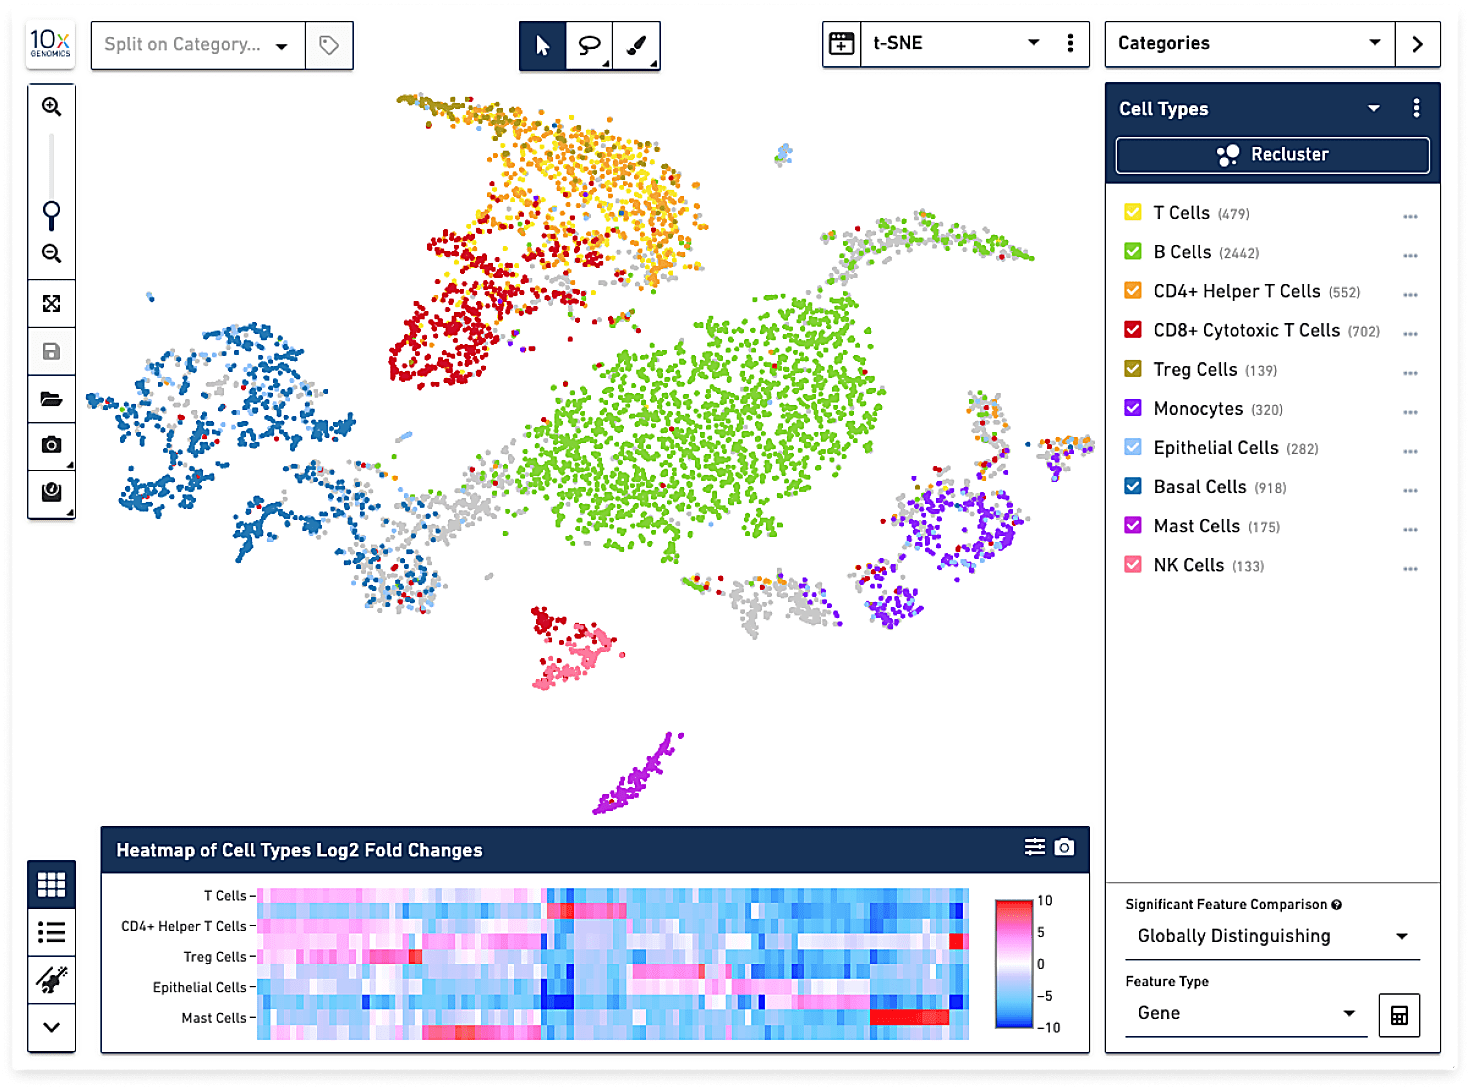
Explore cell type compositions
Examine and refine cell clusters to identify new or rare cell types.
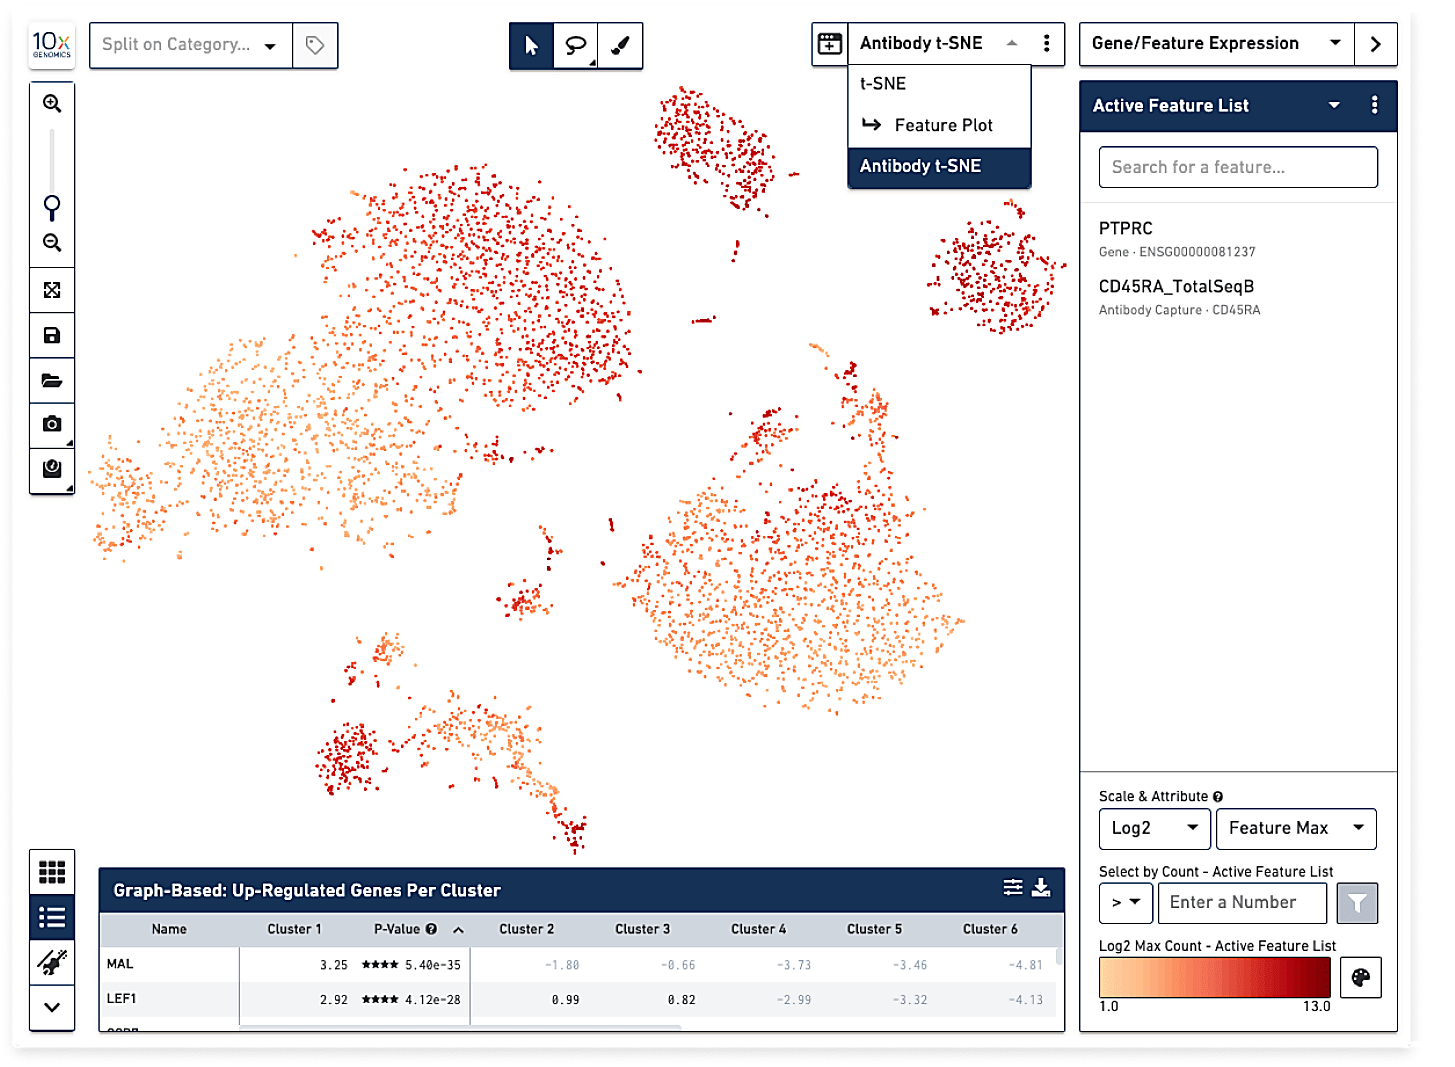
Discover multiomic insights
Utilize single cell gene and protein expression data to comprehensively profile new cell states.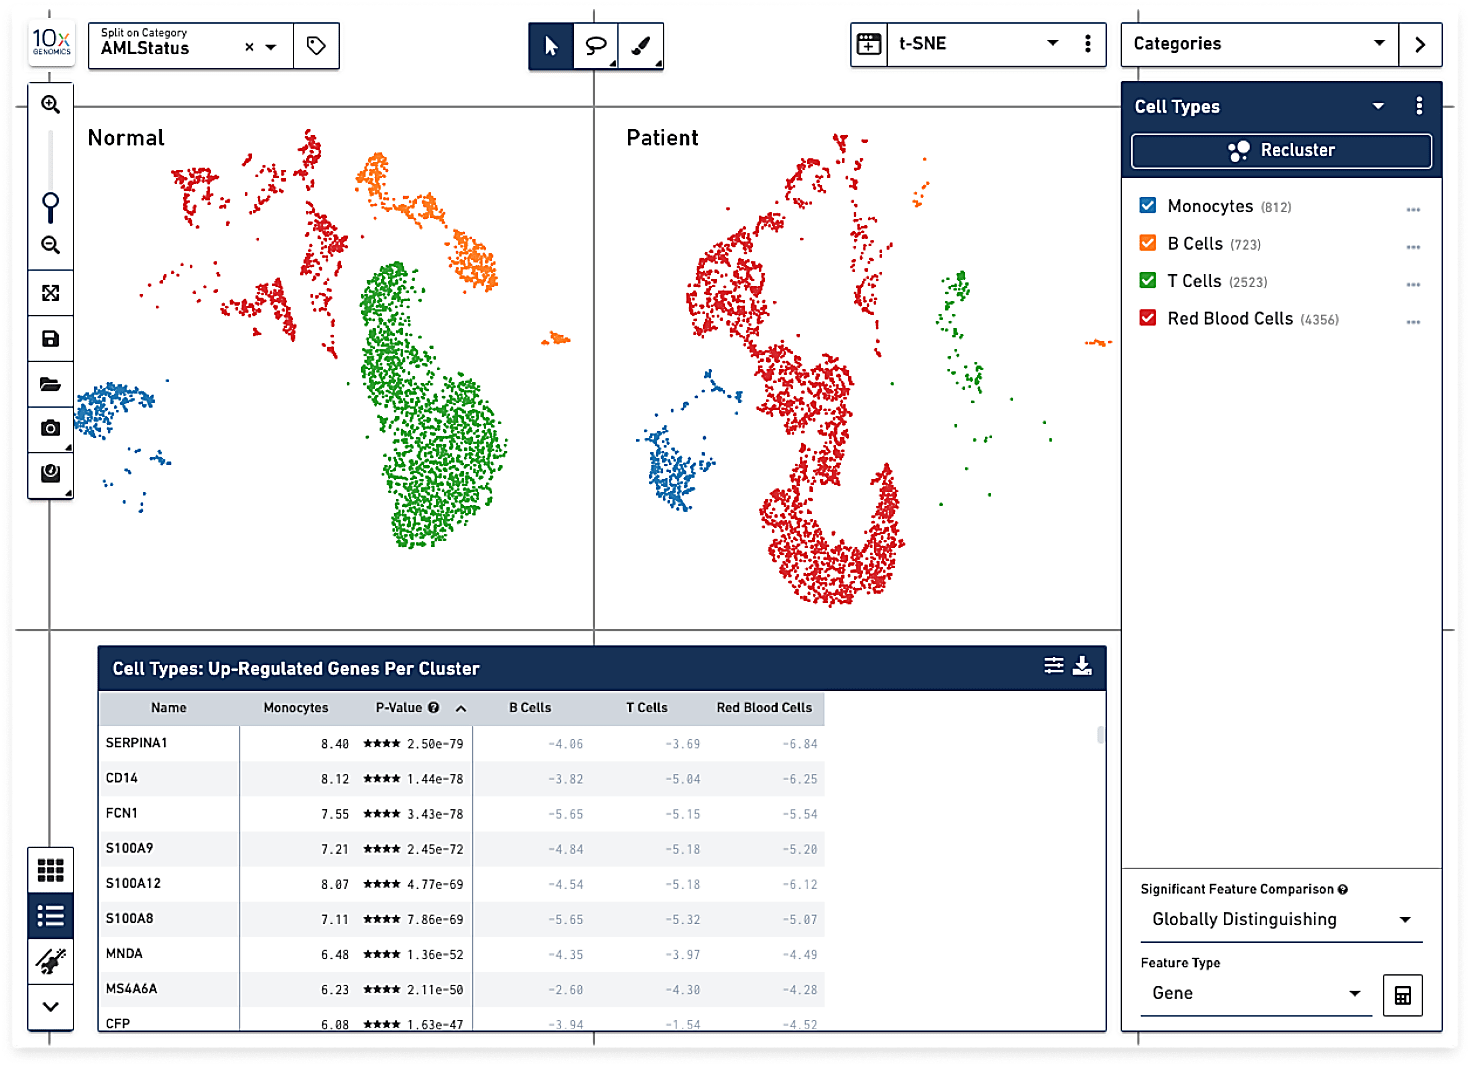
Compare across samples
Uncover differences in expression patterns, cell types, and their abundance.
Gain a multiomic view of the immune response
Overlay gene expression and V(D)J data
- Annotate immune cell subtypes by overlaying clonotype information onto gene expression profiles.
- Visually explore links between phenotype and clonotype information by overlaying cell surface protein data.

Explore the immune repertoire
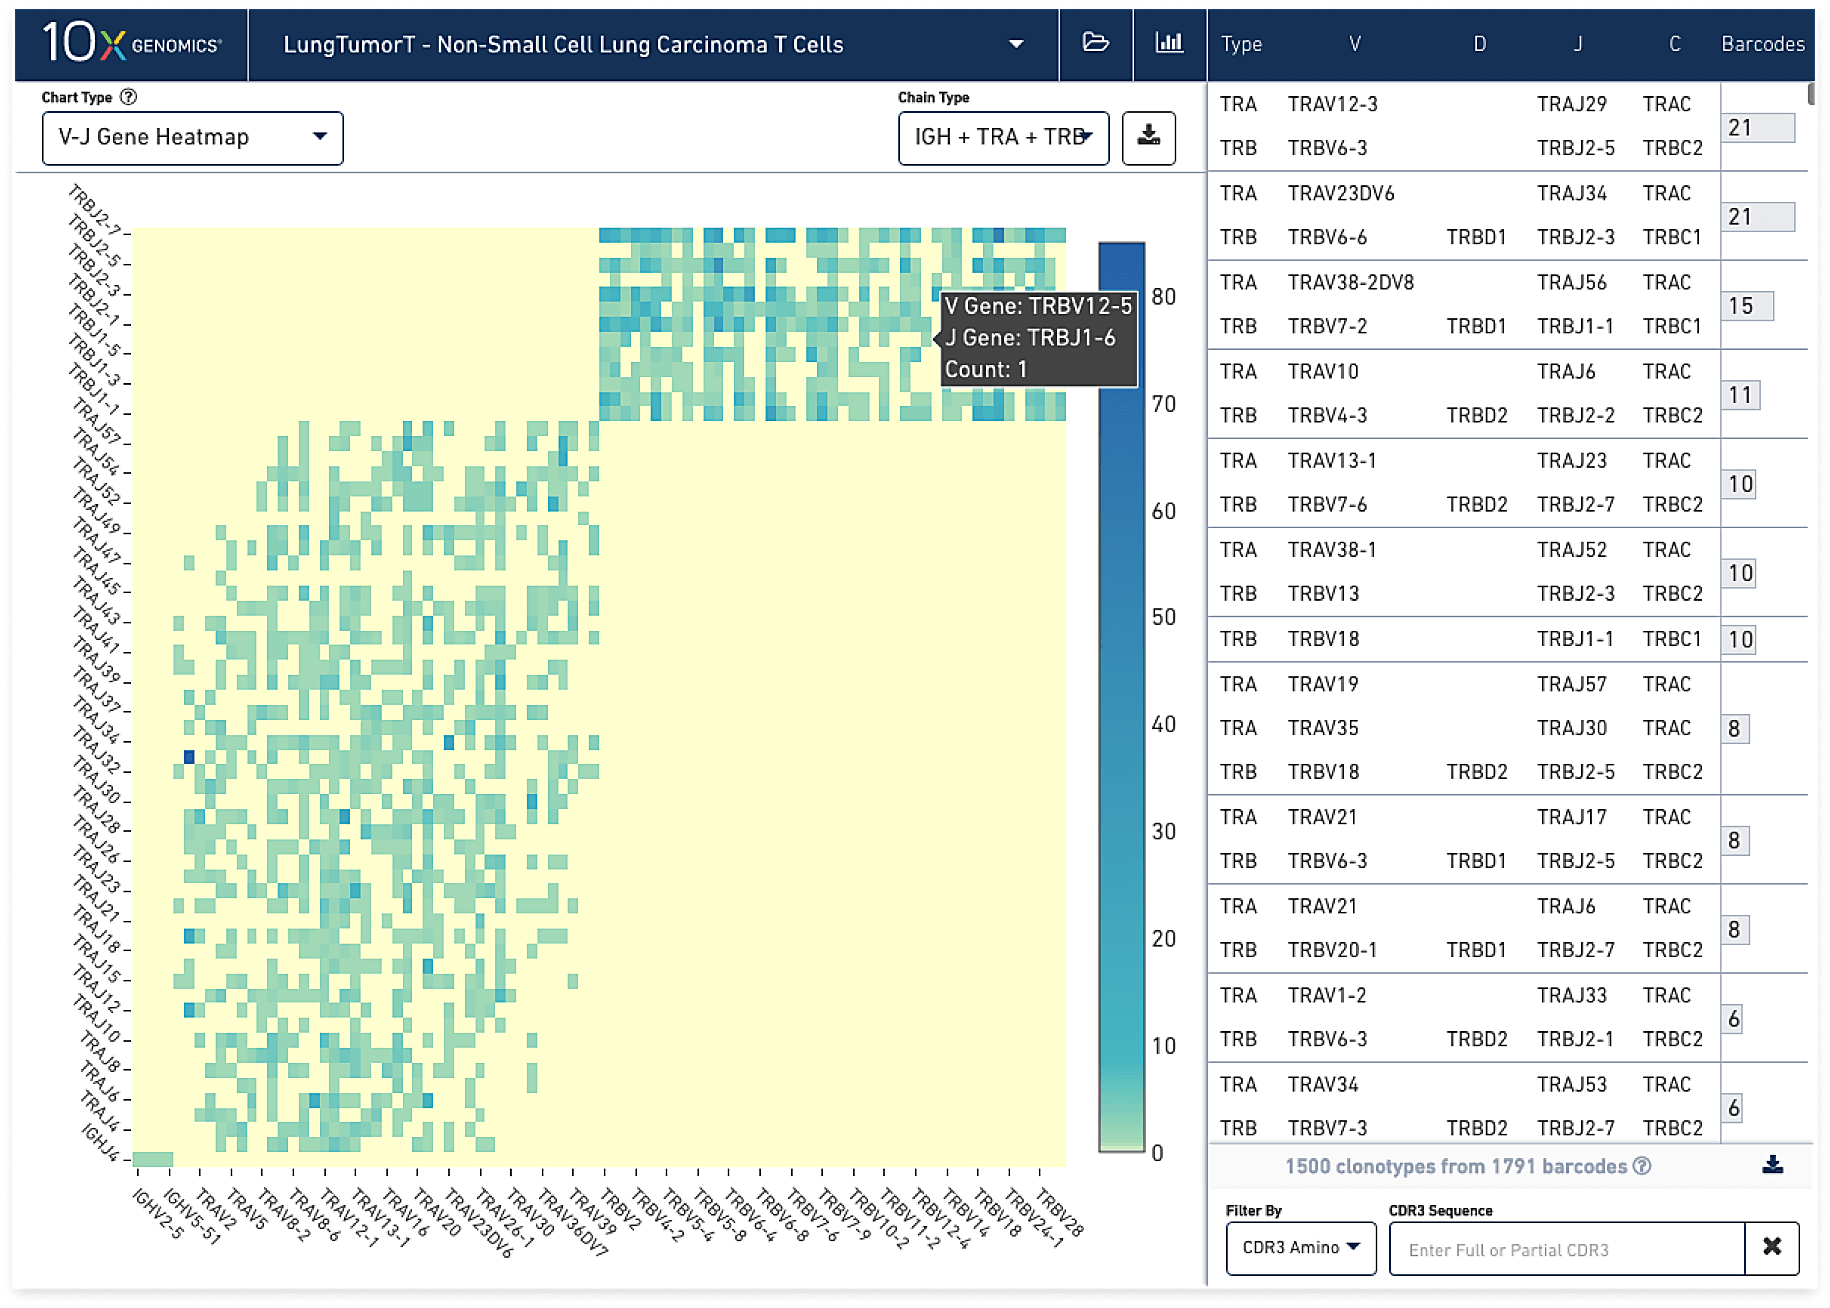
For our Single Cell Immune Profiling product, we provide an additional visualization software, Loupe V(D)J Browser, for more in-depth analysis of data.- Evaluate clonotype frequency, V(D)J gene usage, and pairing distribution to characterize T- and B-cell repertoire.
- Visualize and compare key repertoire metrics across cell types and samples.
Unify epigenomic and transcriptomic insights
- Uncover multiomic markers for cell-type classification.
- Refine cell types and states using simultaneous chromatin accessibility and gene expression measurements from the same single cells.
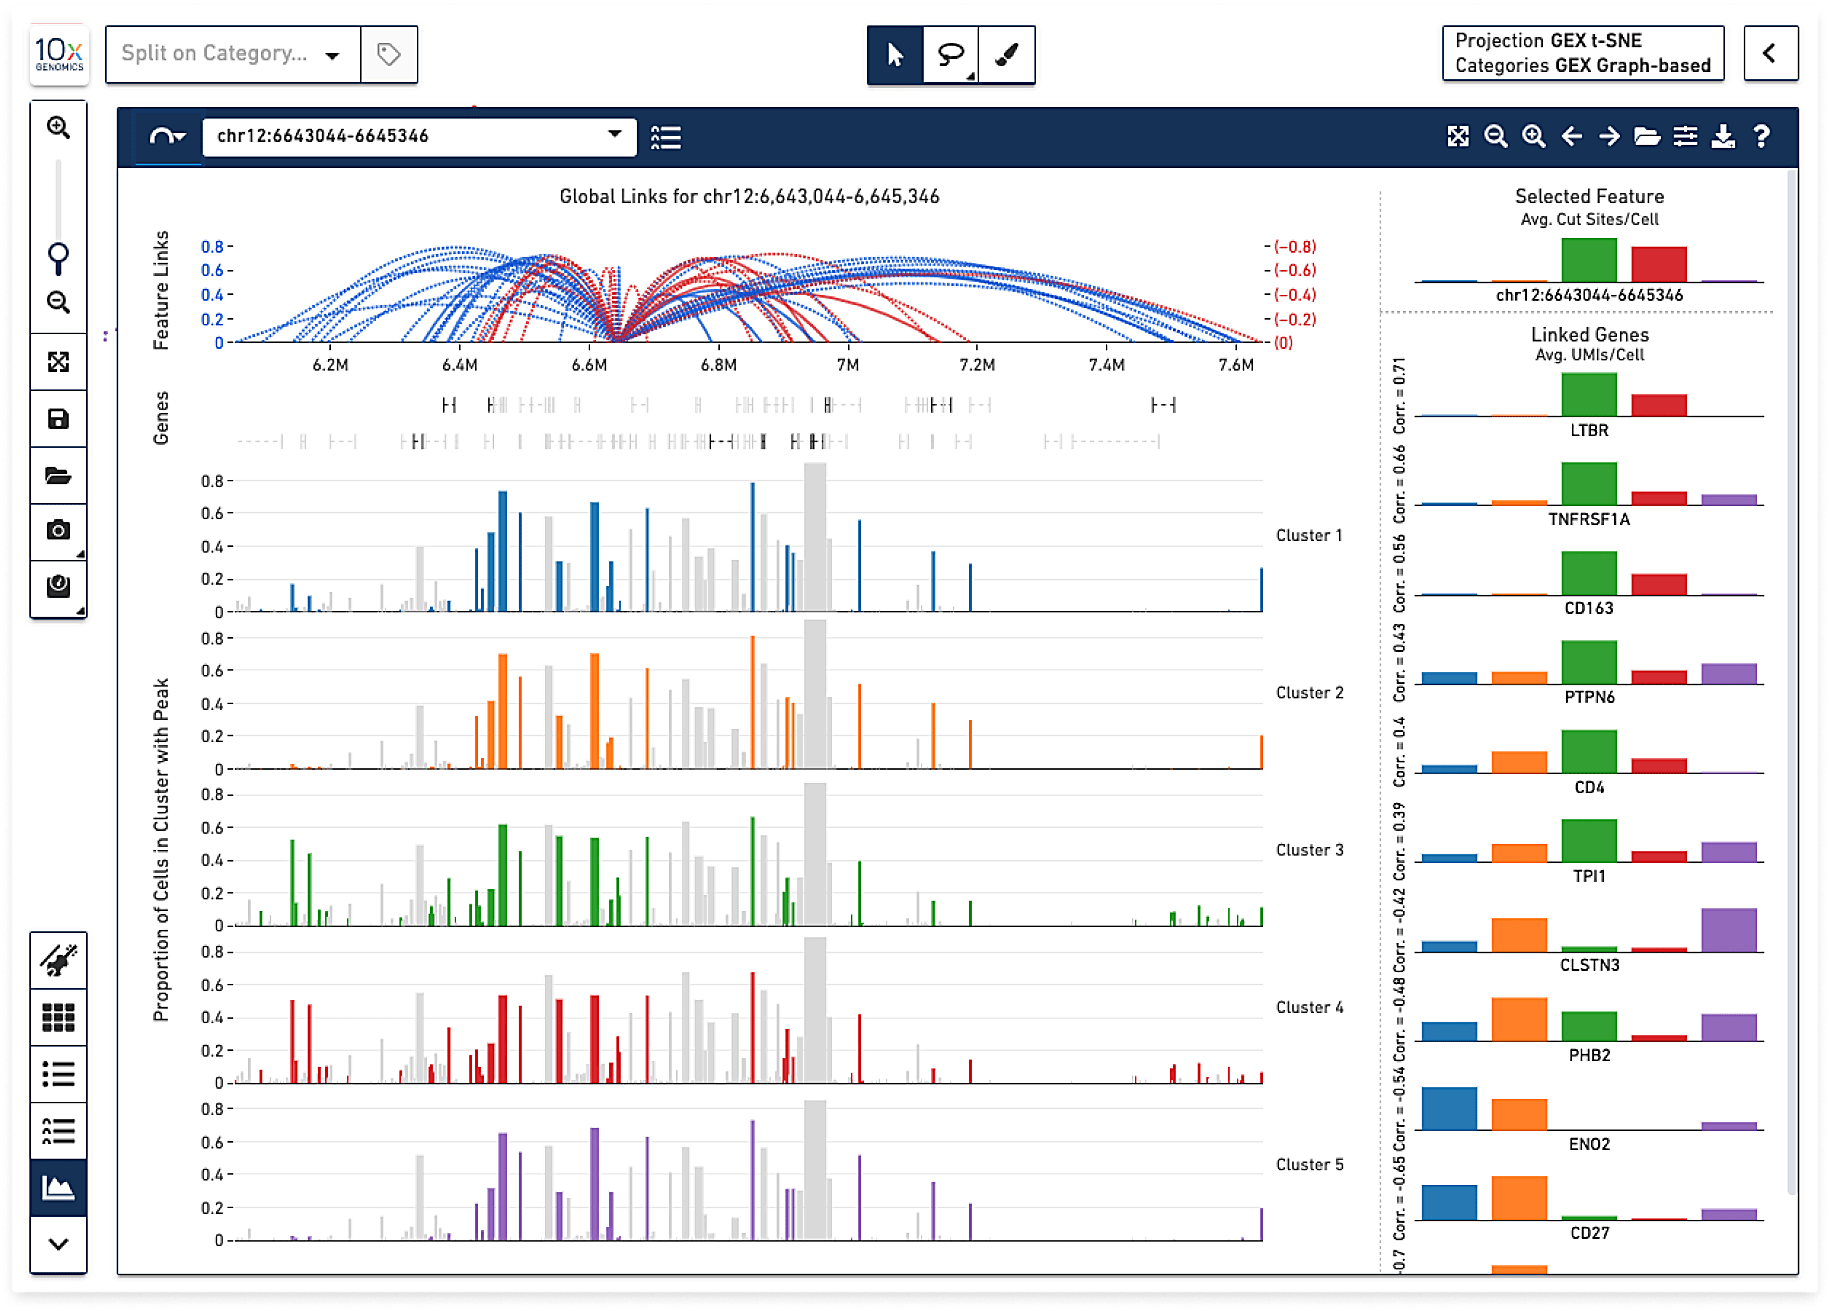
- Investigate gene regulatory linkages between open chromatin peaks and gene expression.
Visualize tissue transcriptomics
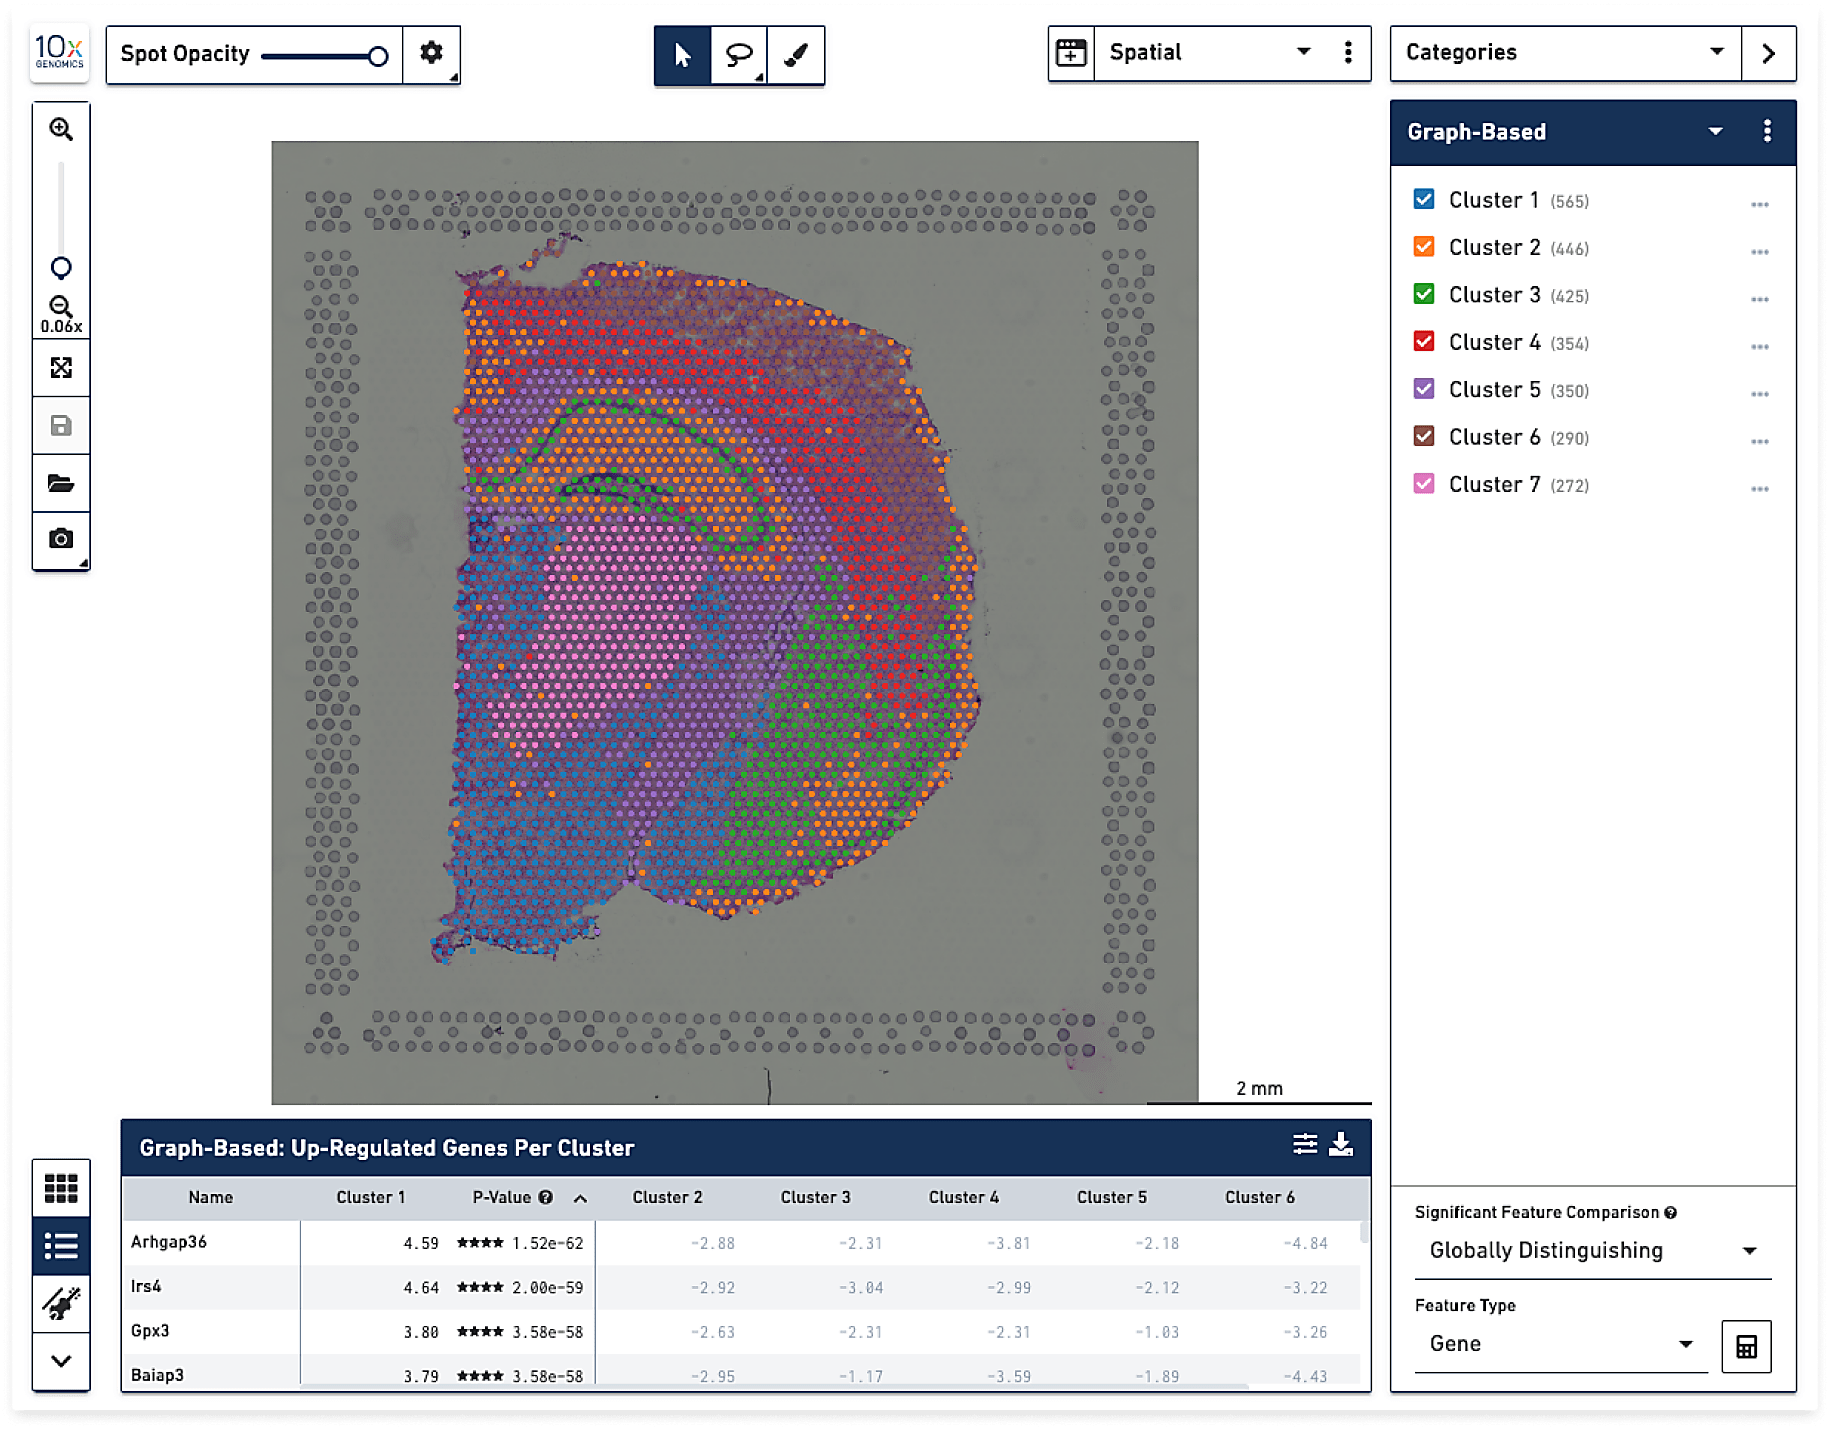
- Analyze gene expression patterns to determine cell types and their localization within a tissue section.
- Perform differential gene expression analysis across regions of interest.
- Overlay gene expression, and protein expression onto tissue morphology.
Loupe Browser enables data analysis for many single cell applications
Epigenetics
Explore Single Cell ATAC data in Loupe Browser to perform differential chromatin accessibility analysis, find cell clusters enriched for transcription factor motifs of interest, and compare open chromatin profiles across samples.
Barcode Enabled Antigen Mapping
Screen the binding specificities of multiple antigens or epitopes for B or T cells using Single Cell 5’ Barcode Enabled Antigen Mapping. Obtain the corresponding paired, full-length receptor sequences for downstream expression and functional testing.
Multiomic Cytometry
Visualize and interpret results from your Multiomic Cytometry experiment for more robust cell-type identification using both cell surface proteins and gene expression readouts.
CRISPR Screening
Visualize data from Single Cell CRISPR Screening to characterize CRISPR perturbation phenotypes across guide targets and assess knockdown efficacy.
Frequently Asked Questions
Loupe Browser supports the analysis of data from the following products:
Loupe V(D)J Browser is a separate visualization software application that provides specific functionality to analyze TCR and BCR clonotype information from the Single Cell Immune Profiling product.
Loupe Browser is a point-and-click software that enables anyone, no matter their level of bioinformatics expertise, to analyze 10x Genomics data.
Loupe Browser uses a .loupe file to visualize 10x Genomics data. The .loupe file is generated by downloading and running the compatible 10x Genomics Analysis Software (see 10x Genomics Cloud Analysis for options to run software quickly and easily), which processes raw data into standard file formats that can be used for downstream interpretation. Once you have generated the Analysis Software output you can download the latest version of Loupe Browser and start to analyze your data.
The following resources are available to help you analyze data with Loupe Browser:
- Explore example datasets - https://10xgenomics.com/resources/datasets/
- Find Loupe documentation and tutorials specific to each product on the Support site
Loupe Browser is available at no cost to anyone analyzing 10x Genomics data.
