Maximize your insights
Gain a deeper, more complete assessment of your samples with protein, total mRNA, and morphology in one.
Profile entire tissue sections
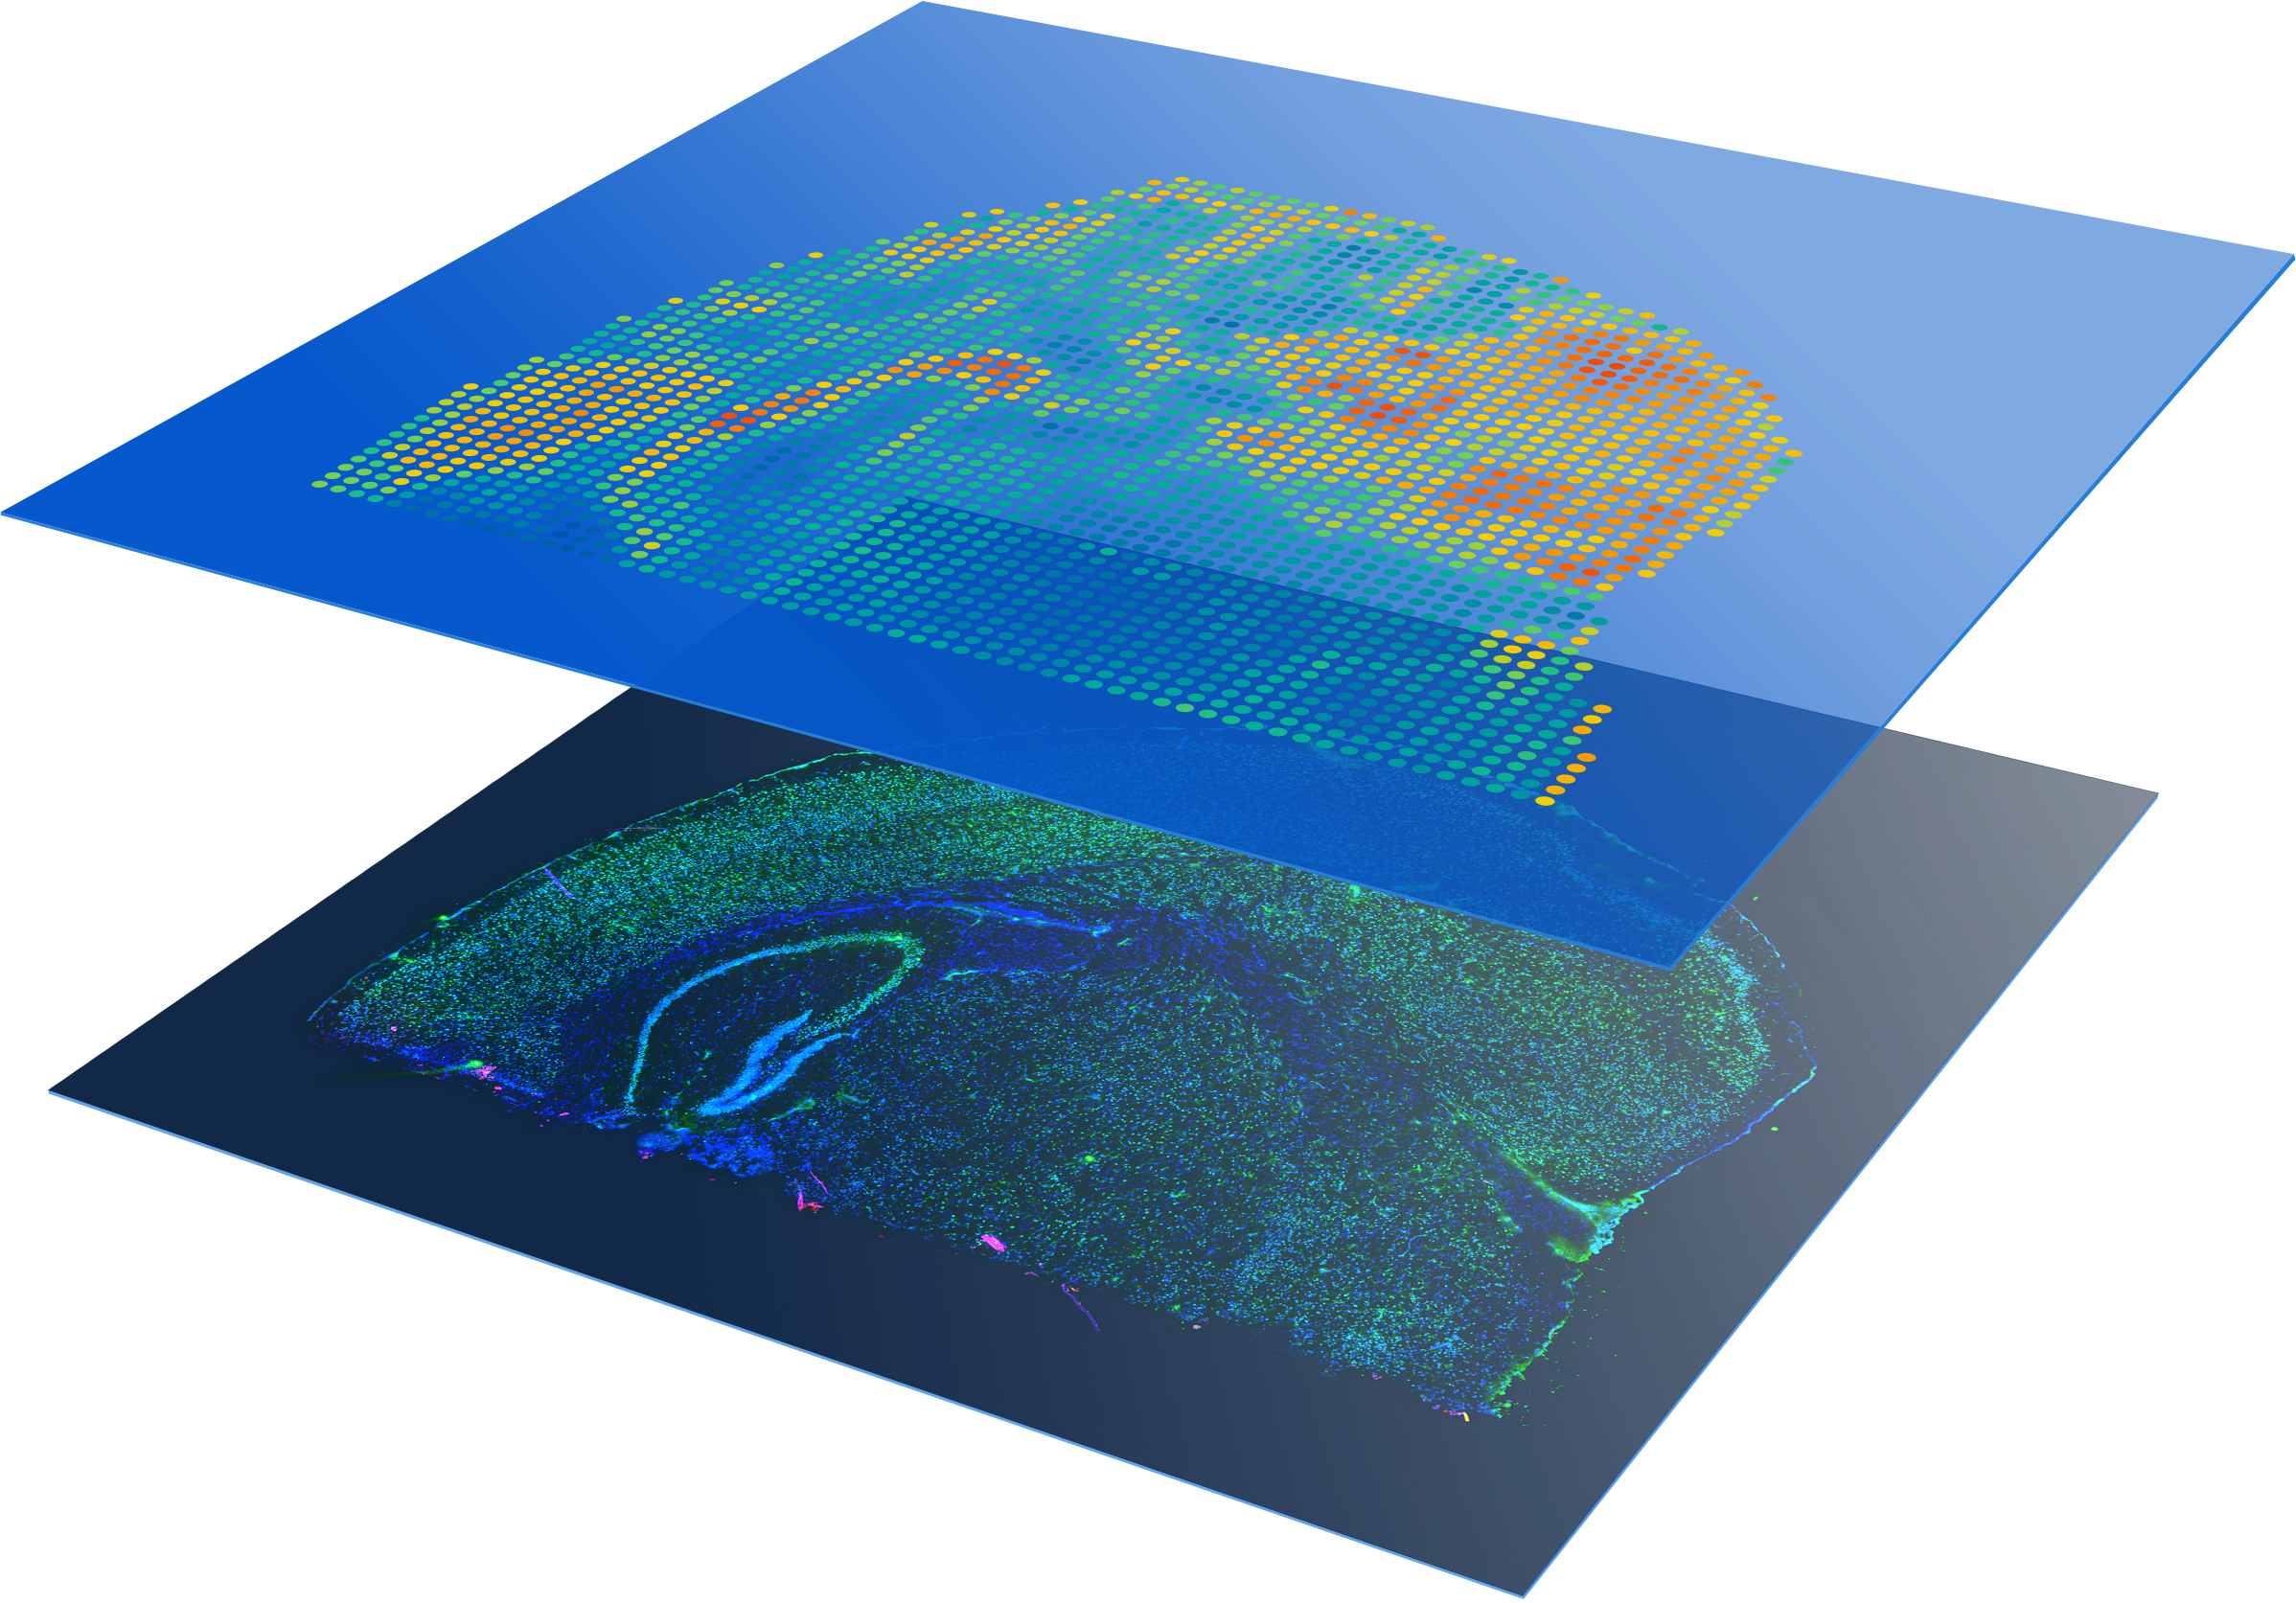
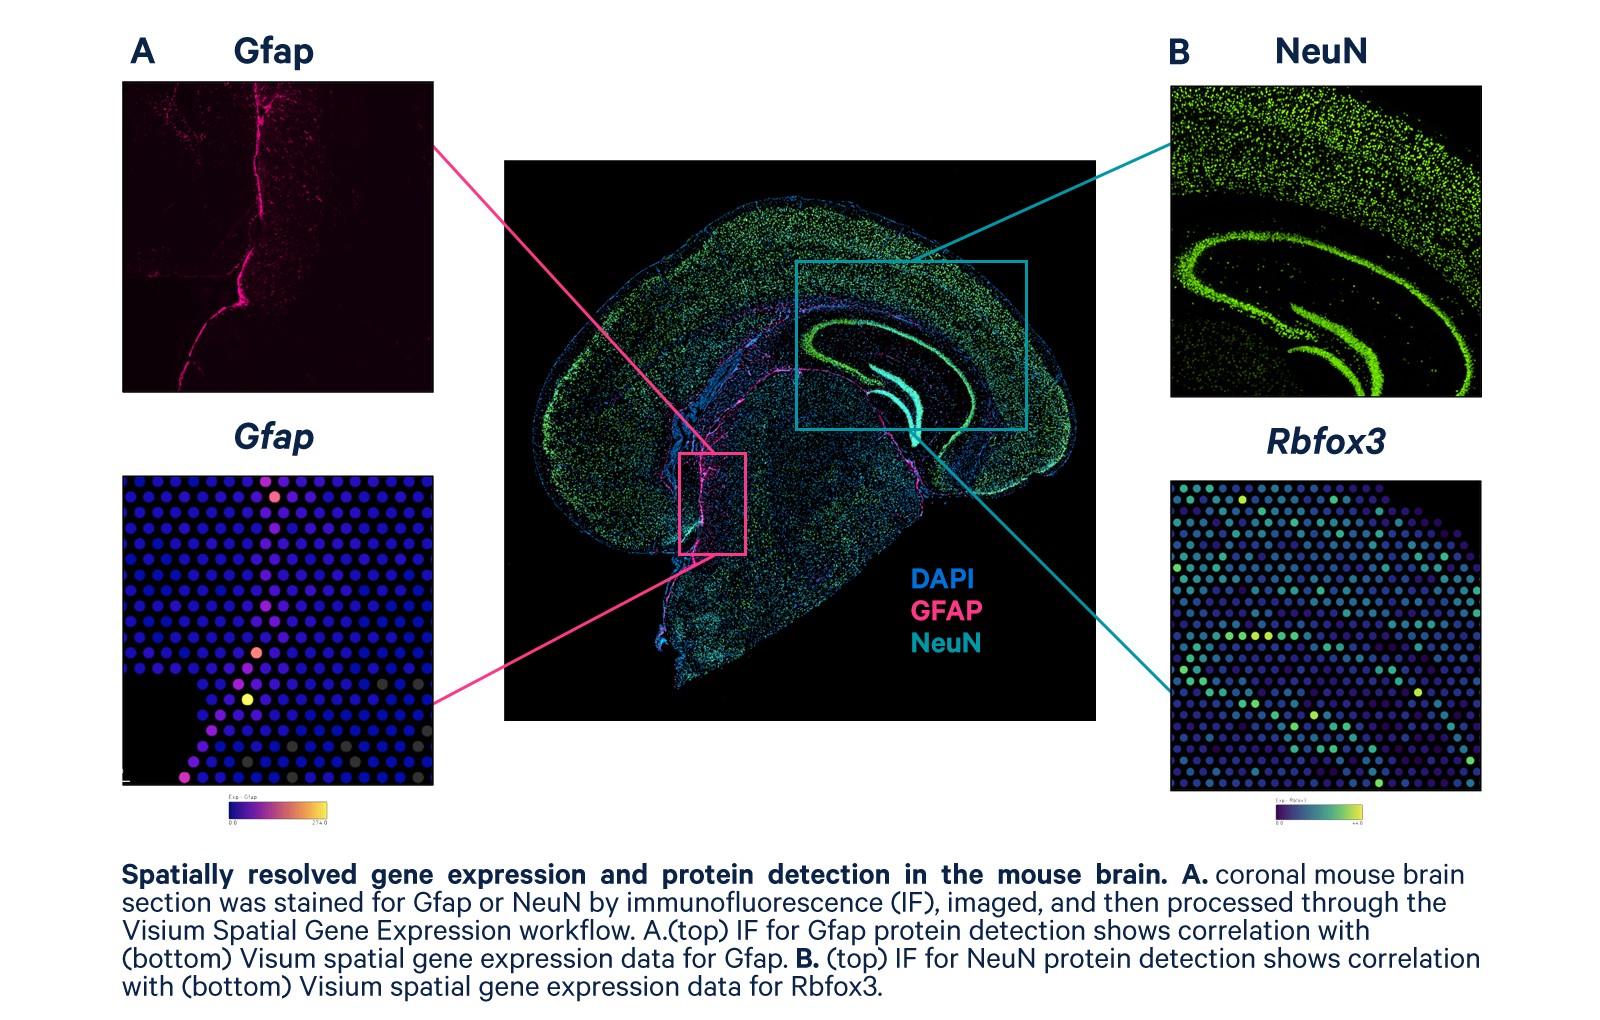
Visualize protein detection and whole transcriptome expression, without selecting regions of interest.
Accessible technology
Use standard microscopy, immunofluorescence staining protocols, and antibodies.
Streamlined data analysis
Combine protein detection profiles with gene expression data in easy-to-use software.
Accelerate discovery
Get to results faster with parallel processing of up four samples per run.
Access more sample types
Compatible with either FFPE or fresh frozen tissue samples.
Explore what you can do
Gain a complete view of disease complexity
Discover new biomarkers and identify novel cell types and states
Map the spatial organization of cell atlases
Identify spatiotemporal gene expression patterns
Rich insights
- Go back in time—Apply new biomarkers to archived FFPE samples and uncover hidden biology from the past
- Multiomic analysis—Characterize heterogeneity more completely with spatial multiomic analysis of protein and mRNA to a single tissue section
- Powerful discovery—Envision the spatial organization of newly discovered cell types, states, and biomarkers with protein detection and whole transcriptome analysis
Proven results
Publications
Transcriptome-scale spatial gene expression in the human dorsolateral prefrontal cortex
Transcriptome-scale spatial gene expression in the human dorsolateral prefrontal cortex
Maynard KR, et al. Nature (2021).
Maynard KR, et al. Nature (2021).
Mapping the developing human immune system across organs
Mapping the developing human immune system across organs
Suo C, et al. Science (2022).
Suo C, et al. Science (2022).
Single-cell and spatial analysis reveal interaction of FAP+ fibroblasts and SPP1+ macrophages in colorectal cancer
Single-cell and spatial analysis reveal interaction of FAP+ fibroblasts and SPP1+ macrophages in colorectal cancer
Qi J, et al. Nature Communications (2022).
Qi J, et al. Nature Communications (2022).
Resources
Find the latest app notes and other documentation Spatial Gene Expression.
Inside Visium spatial capture technology
Inside Visium spatial capture technology
Brochure, 10x Genomics
Brochure, 10x Genomics
Resolving brain architecture with comprehensive spatial gene expression
Resolving brain architecture with comprehensive spatial gene expression
Data Spotlight, 10x Genomics
Data Spotlight, 10x Genomics
Our end-to-end solution
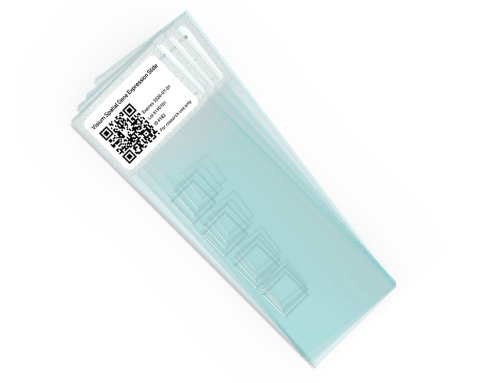
Visium Spatial Gene Expression Slides
Easily adoptable within existing lab infrastructure, no need for a new instrument.
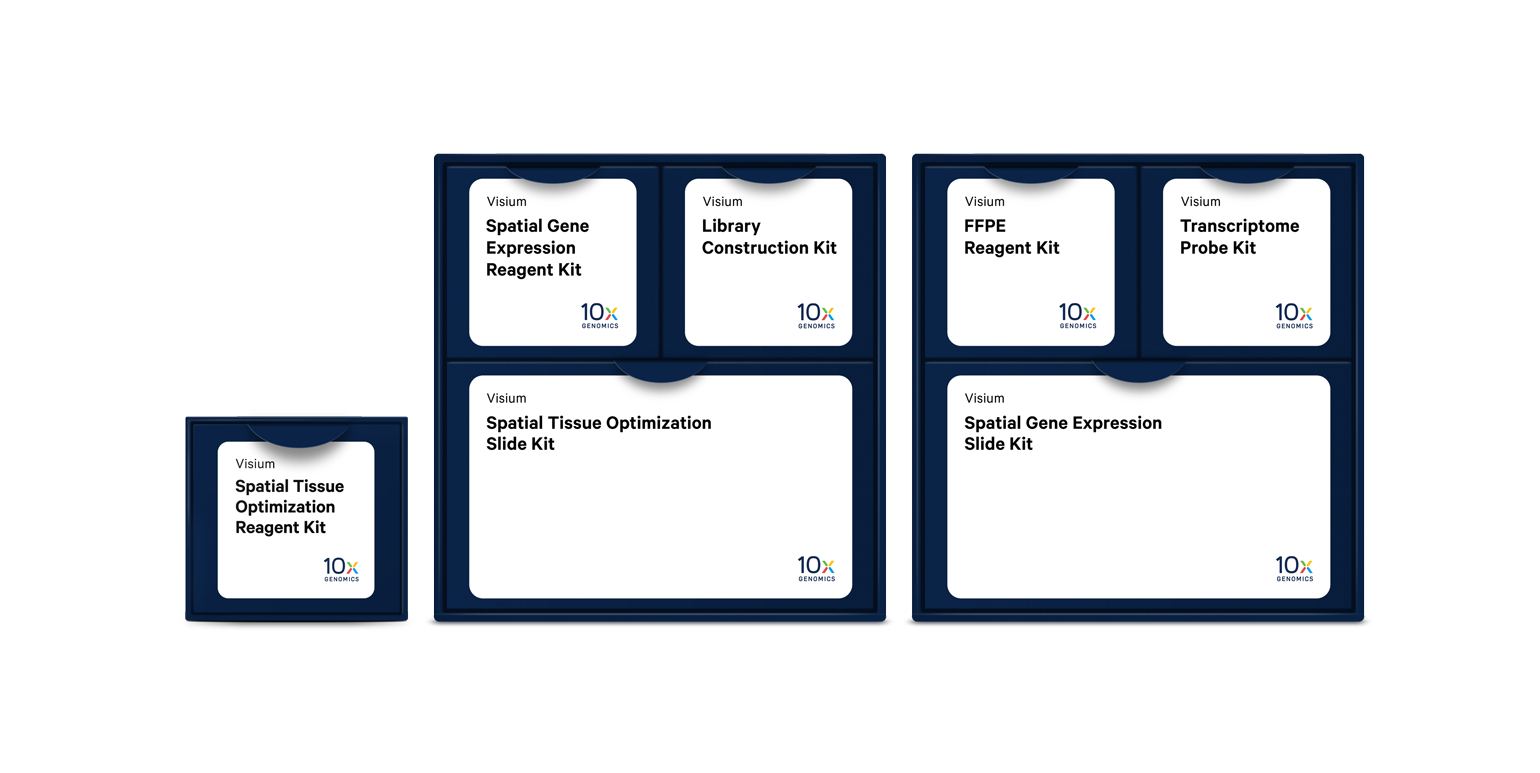
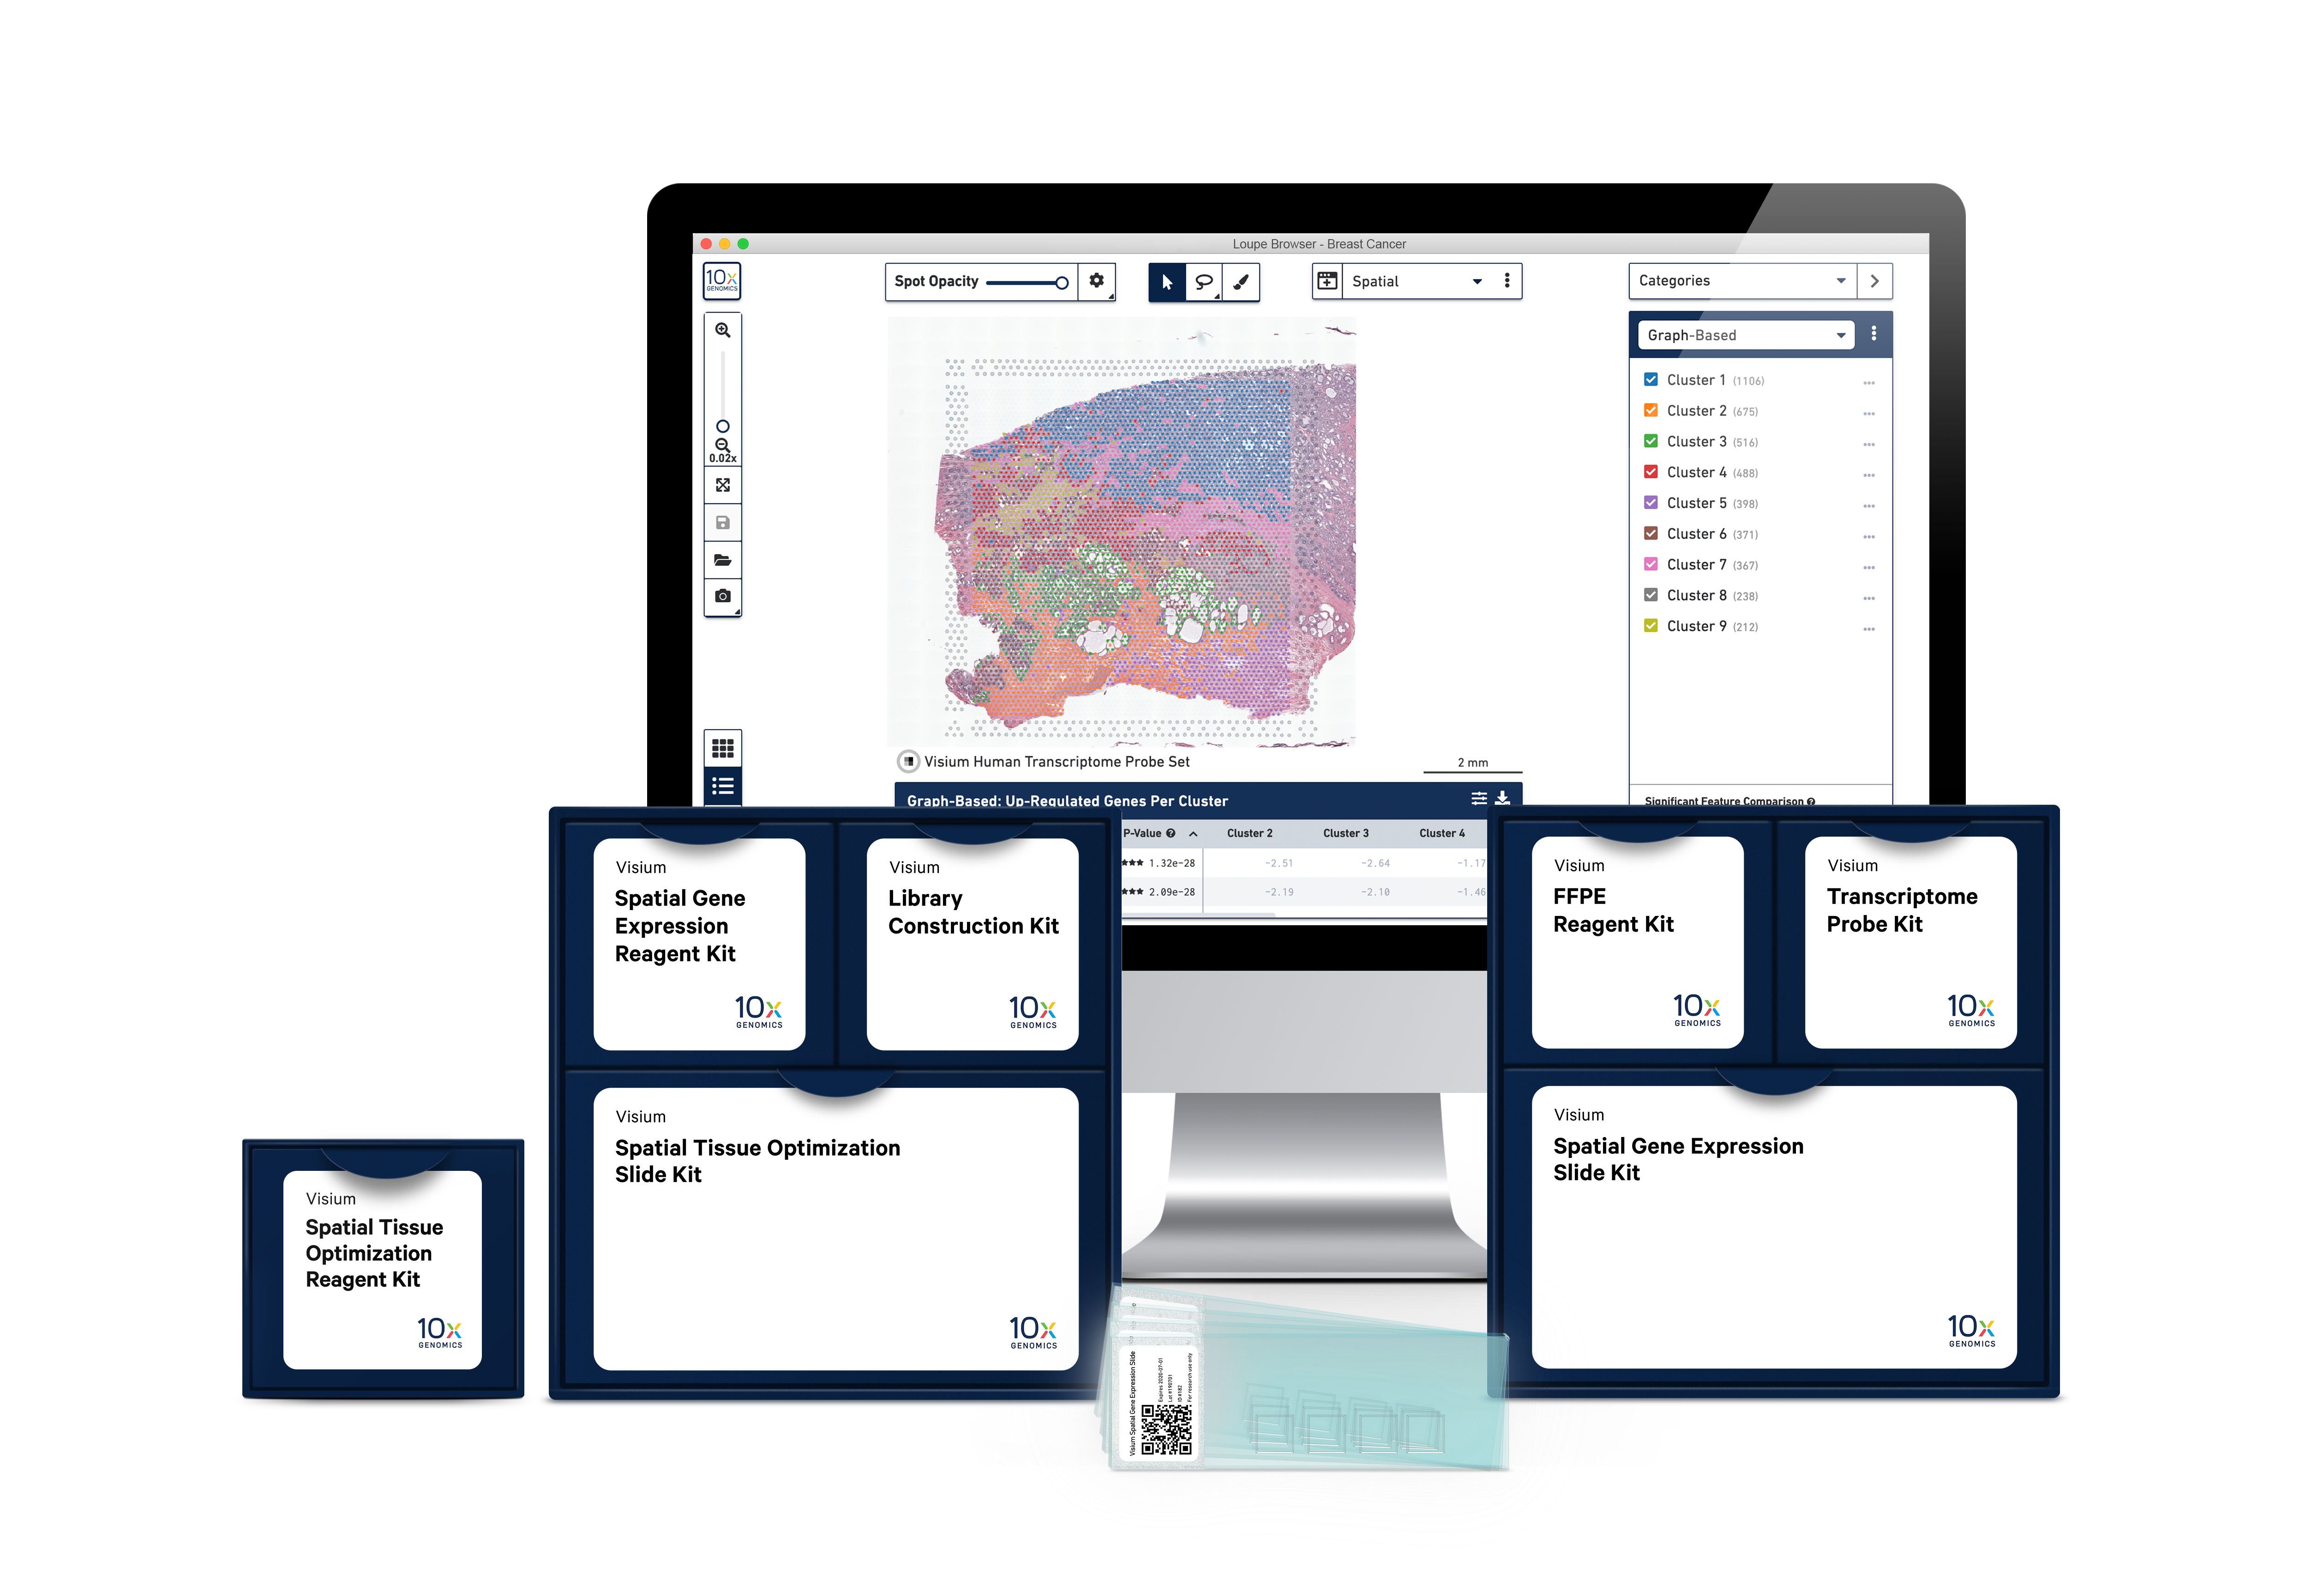
Visium Spatial Gene Expression reagents
With our reagent kits, capture whole transcriptome gene expression with spatial resolution across an entire tissue section.
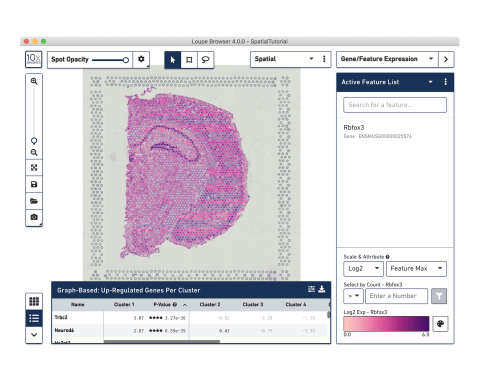
Analysis and visualization software
Our analysis pipelines
Our visualization software

World-class technical and customer support
Our expert support team can be contacted by phone or email at support@10xgenomics.com
Workflow
- 1
Prepare your sample
Embed, section, and place fresh frozen or FFPE tissue onto a Capture Area of the gene expression slide. Each Capture Area has thousands of barcoded spots containing millions of capture oligonucleotides with spatial barcodes unique to that spot.
Resources - 2
Stain and image the tissue
Utilize standard fixation and immunofluorescence (IF) staining to visualize tissue sections and protein markers using a fluorescent microscope.
Resources - 3
Permeabilize tissue and construct library
For fresh frozen tissue, the tissue is permeabilized to release mRNA from the cells, which binds to the spatially barcoded oligonucleotides present on the spots. A reverse transcription reaction produces cDNA from the captured mRNA. The barcoded cDNA is then pooled for downstream processing to generate a sequencing-ready library. For FFPE tissues, tissue is permeabilized to release ligated probe pairs from the cells, which bind to the spatially barcoded oligonucleotides present on the spots. Spatial barcodes are added via an extension reaction. The barcoded molecules are then pooled for downstream processing to generate a sequencing-ready library.
Resources - 4
Sequence
The resulting 10x Barcoded library is compatible with standard NGS short-read sequencing on Illumina sequencers, for massive transcriptional profiling of entire tissue sections.
Resources - 5
Analyze and visualize your data
Use our Space Ranger analysis software to process your Spatial Gene Expression data, and interactively explore the results with our Loupe Browser visualization software.
Do I need to be a bioinformatician to use Loupe?
Loupe is a point-and-click software that’s easy for anyone to download and use.
Resources
Frequently asked questions
The Visium Spatial Gene Expression workflow is compatible with most fluorescence imaging systems, so the number of protein targets you can detect is dependent on your antibody selection and imaging configuration. We support up to four IF markers and recommend that DAPI be used for one of the channels. Please review our imaging guidelines (FFPE | Fresh frozen) for additional information.
Yes, there are several key differences between standard IF and the IF protocol used with Visium. Please refer to the IF Demonstrated Protocol (FFPE | Fresh frozen) for additional details.
Impact on Visium performance may vary from tissue to tissue due to the high sensitivity of the Visium assay. However, the spatial organization of gene expression and cell cluster detection is comparable between H&E and IF.
Visium is compatible with fresh frozen and FFPE tissues containing mRNA. We have separate kits that utilize different chemistries for fresh frozen and FFPE tissues. A list of tissues successfully tested in-house with the Visium assay can be found below.
Successfully tested tissues: FFPE tissues | Fresh frozen tissues
10x Genomics provides two types of software to help you analyze your data: Space Ranger and Loupe Browser. Space Ranger is an analysis software which automatically overlays spatial gene expression information on your tissue image and identifies clusters of spots with similar transcription profiles. You can then use Loupe Browser, a visualization software, to interactively explore the results. You can download Space Ranger and Loupe Browser from the 10x Genomics Support site at no cost.
