Xenium Explorer is a desktop application that allows you to interactively visualize RNA transcript localization in tissues with subcellular resolution from data generated by the Xenium Analyzer instrument. This Getting Started tutorial will help you navigate the core functionality of Xenium Explorer.
The Xenium Analyzer output files listed below are needed to use all Xenium Explorer features (see Understanding Xenium Outputs for all output file descriptions). The experiment.xenium and morphology.ome.tif files are required for minimum Xenium Explorer function. While optional, the other .tif and zarr.zip files are needed to fully explore image, cell segmentation, and transcript information. The analysis_summary.html is needed to view the summary file in Xenium Explorer.
The .xenium manifest file tells Xenium Explorer where to find these files. To properly open a dataset:
- Files must be saved in the same directory path as the manifest file (e.g., default file structure of the Xenium Analyzer output directory), unless file paths have been modified in the manifest file.
- File names must match what is specified in the manifest file (default file names shown in table below).
| File | Description |
|---|---|
| experiment.xenium | (Required) A small JSON manifest file that includes experiment metadata and references to the other data files in the Xenium Analyzer output folder. |
| morphology.ome.tif | (Required) The tissue morphology image is the nuclei-stained (DAPI) image in OME-TIFF format. This file includes a pyramid of resolutions and tiled chunks of image data for efficient interactive image viewing. |
| morphology_mip.ome.tif | (Optional) Maximum intensity projection (mip) of the morphology image. |
| morphology_focus.ome.tif | (Optional) Single best-focus Z-plane of the morphology image. |
| transcripts.zarr.zip | (Optional) Transcript data in zipped Zarr format for visualization in Xenium Explorer. |
| cells.zarr.zip | (Optional) The cell summary file in zipped Zarr format. Includes cell and nucleus boundaries. |
| cell_feature_matrix.zarr.zip | (Optional) The cell-feature matrix file in zipped Zarr format. It contains the transcript count for each gene that was observed inside the segmentation mask of each cell. By default, it only includes transcripts that pass the default Q-Score threshold of Q20. |
| analysis.zarr.zip | (Optional) The secondary analysis outputs in zipped Zarr format. Includes cell clustering results. |
| analysis_summary.html | (Optional) Summary metrics and graphs to QC your run data, in HTML format. |
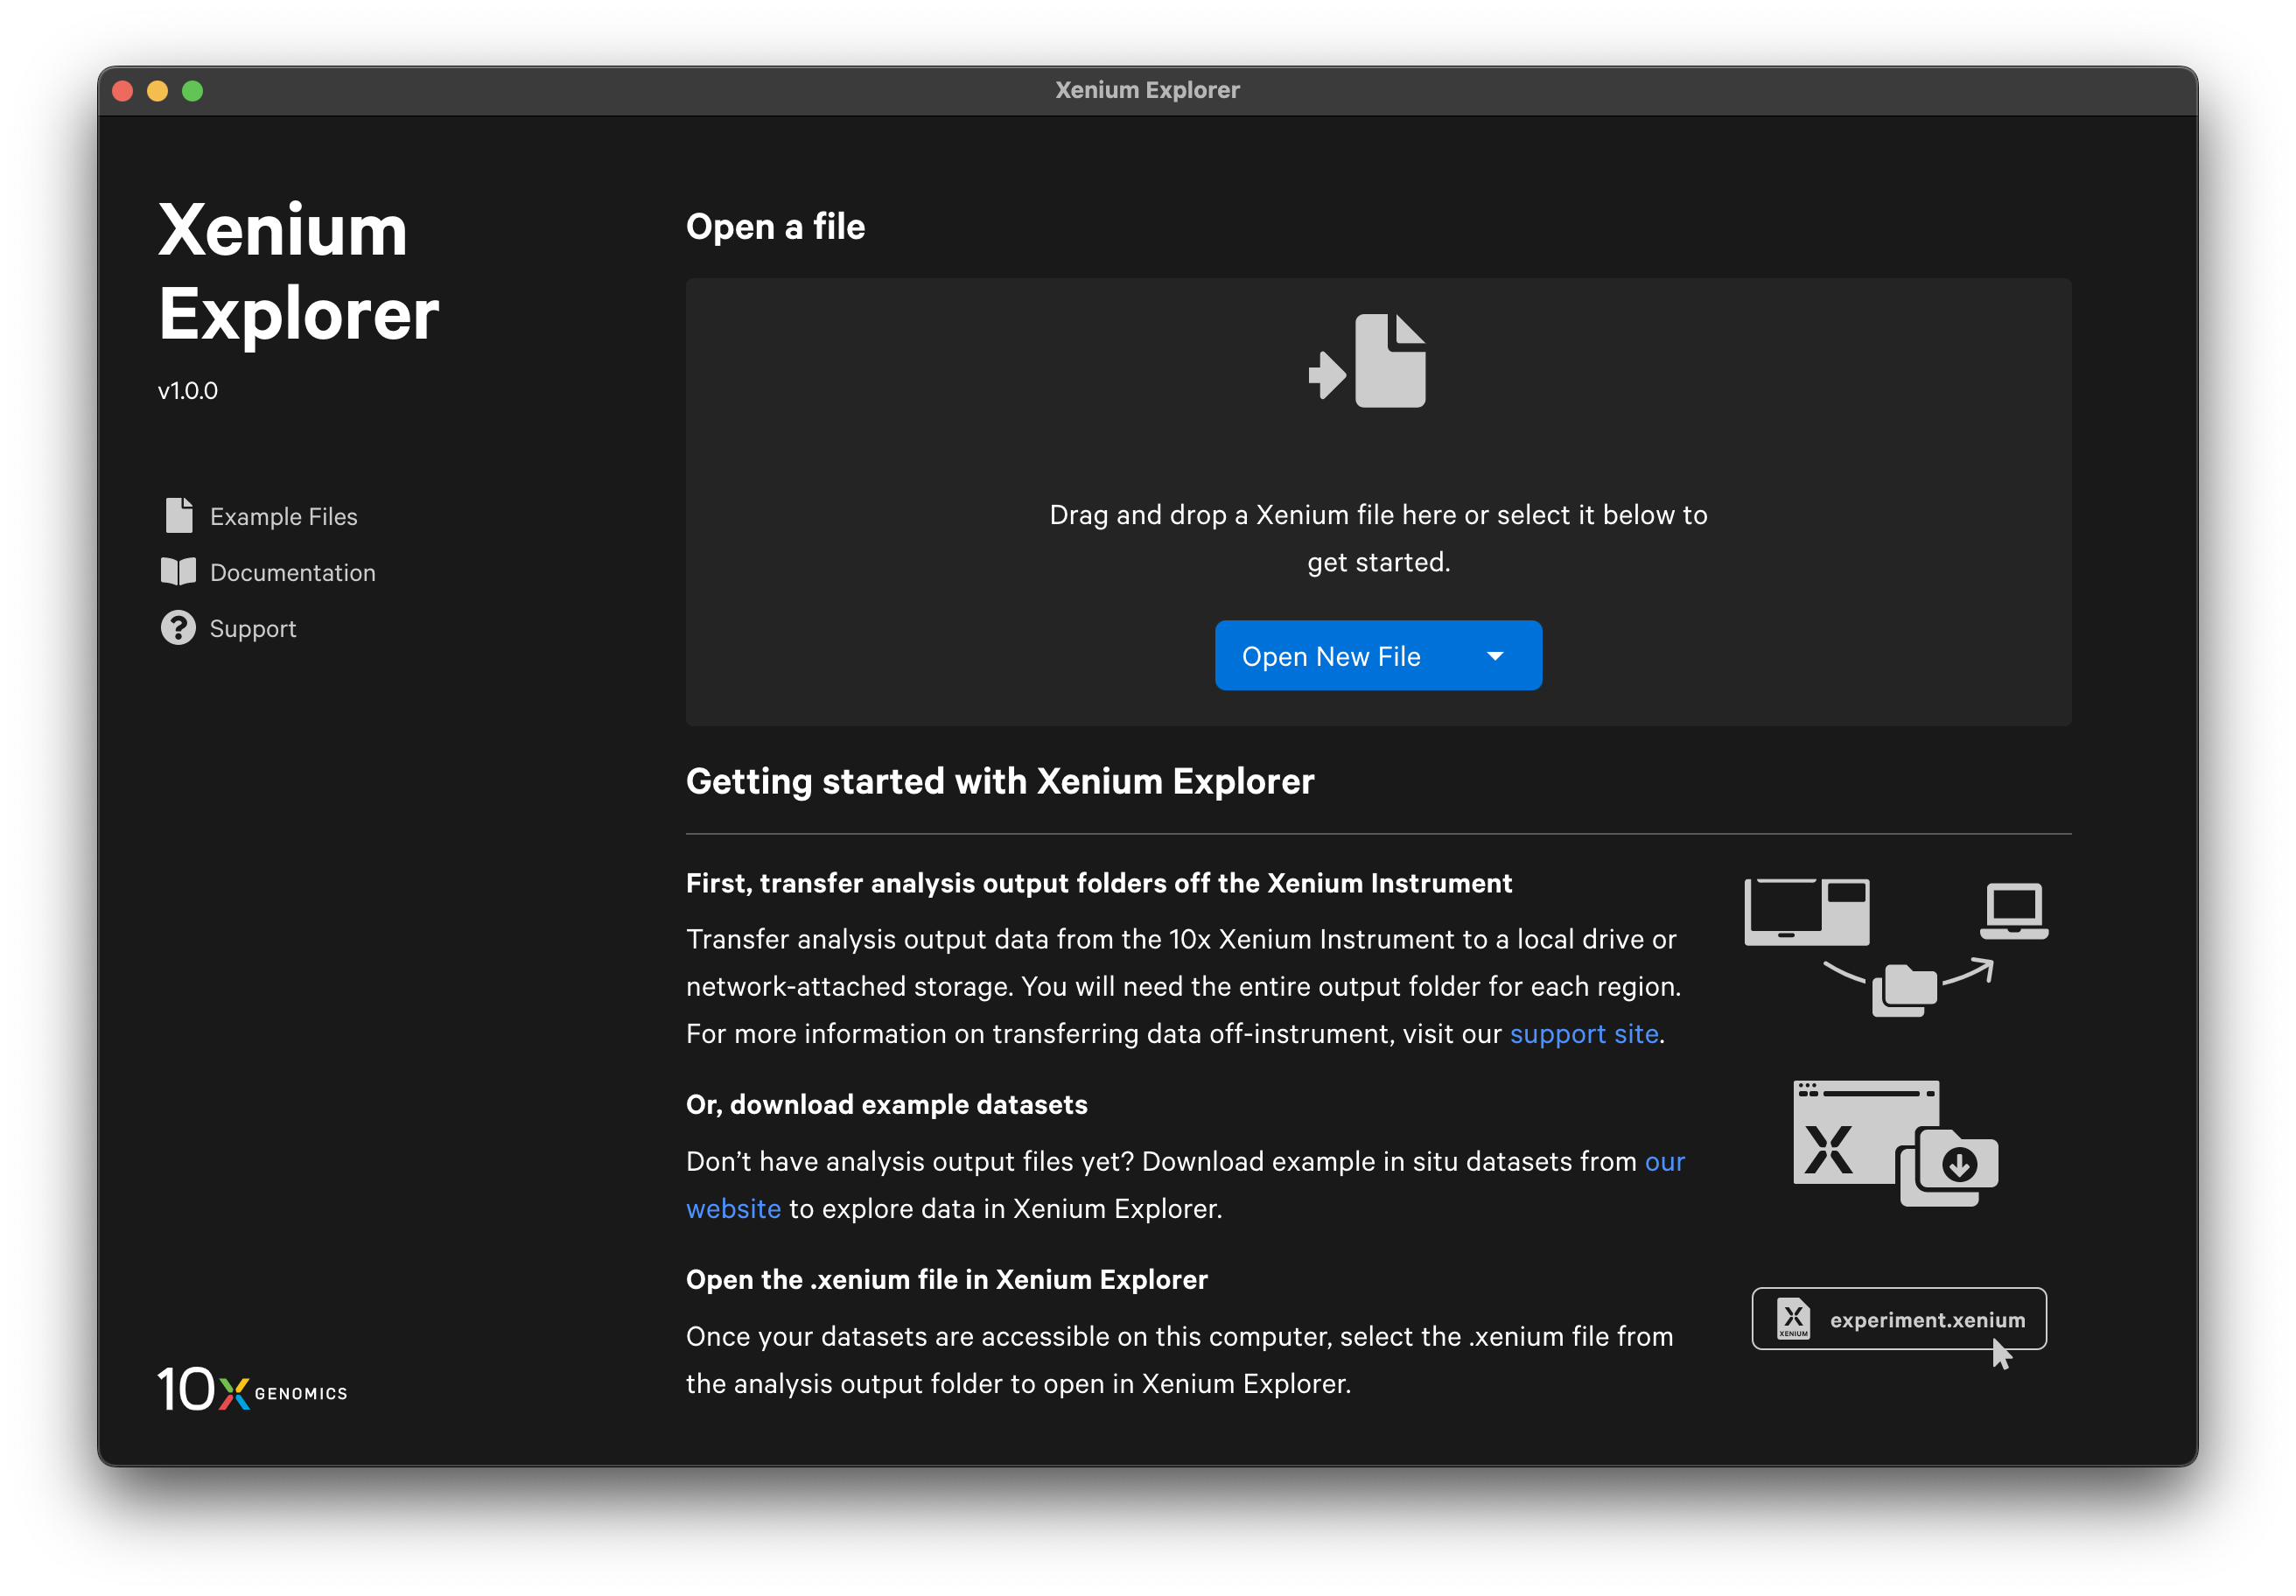
Open Xenium Explorer by double-clicking the application icon.
There are a few options to open a dataset in Xenium Explorer. You can drag and drop or click Open New File to select the .xenium file. There is also a drop-down menu to either Select file (same as Open New File) or Open file from path. If you open a file from path, enter the path to the location where the .xenium file is stored on your computer or network drive.
The Xenium Analyzer output files must be in the same directory path as this file (unless you have modified the file paths).
Recent Files
Once you have opened a dataset, the Xenium Explorer home page displays options to open or clear recent files. Metadata are shown on the recent file tiles. The ten most recent datasets and any saved views will be displayed.
When you close a dataset, the view settings will be saved automatically as an unnamed saved view (similar to explicitly saving current views. If you open a dataset from the Recent Files menu, Xenium Explorer will restore your last view. However, if you open the same dataset from outside the Recent Files menu (drag and drop, double-click .xenium file, or Open New File), Xenium Explorer will open with the default initial view (grayscale DAPI image) and the unnamed saved view will be lost. The best way to ensure you can reopen the view state again later is to save your current view before closing Xenium Explorer.
After the dataset loads, you should see an image of the nuclei-stained (DAPI) sample. The following image shows the key components of the Xenium Explorer interface. In this Getting Started tutorial, we provide a brief overview of the image, cell, transcript, and lasso features. The Save Current View and Share features are described in the Saving and Sharing Results tutorial. 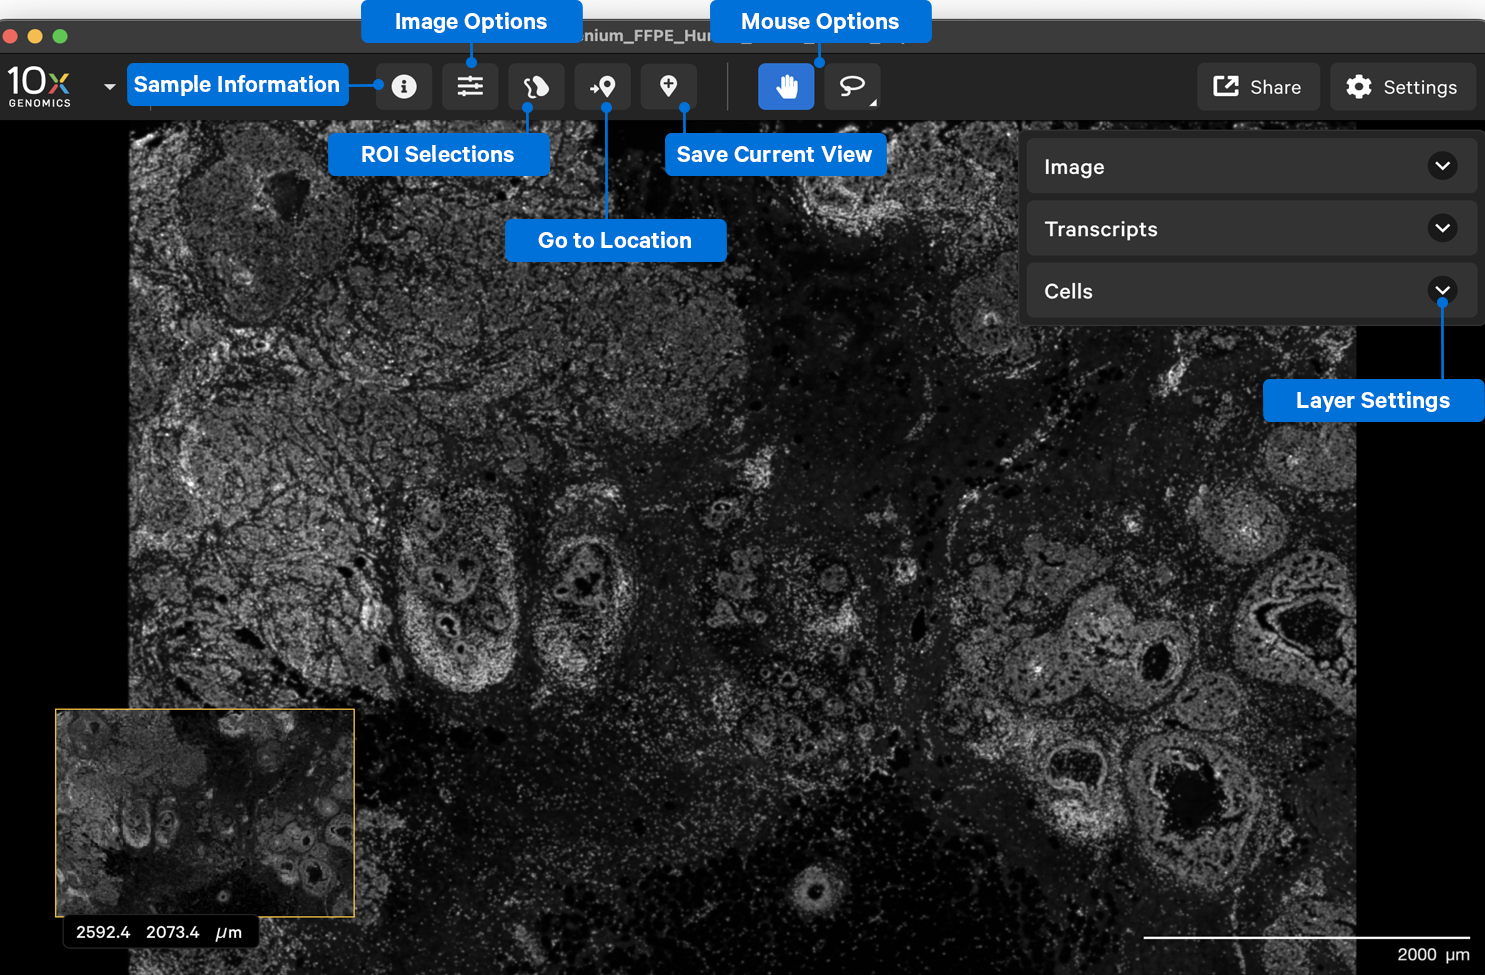
Settings and keyboard shortcuts
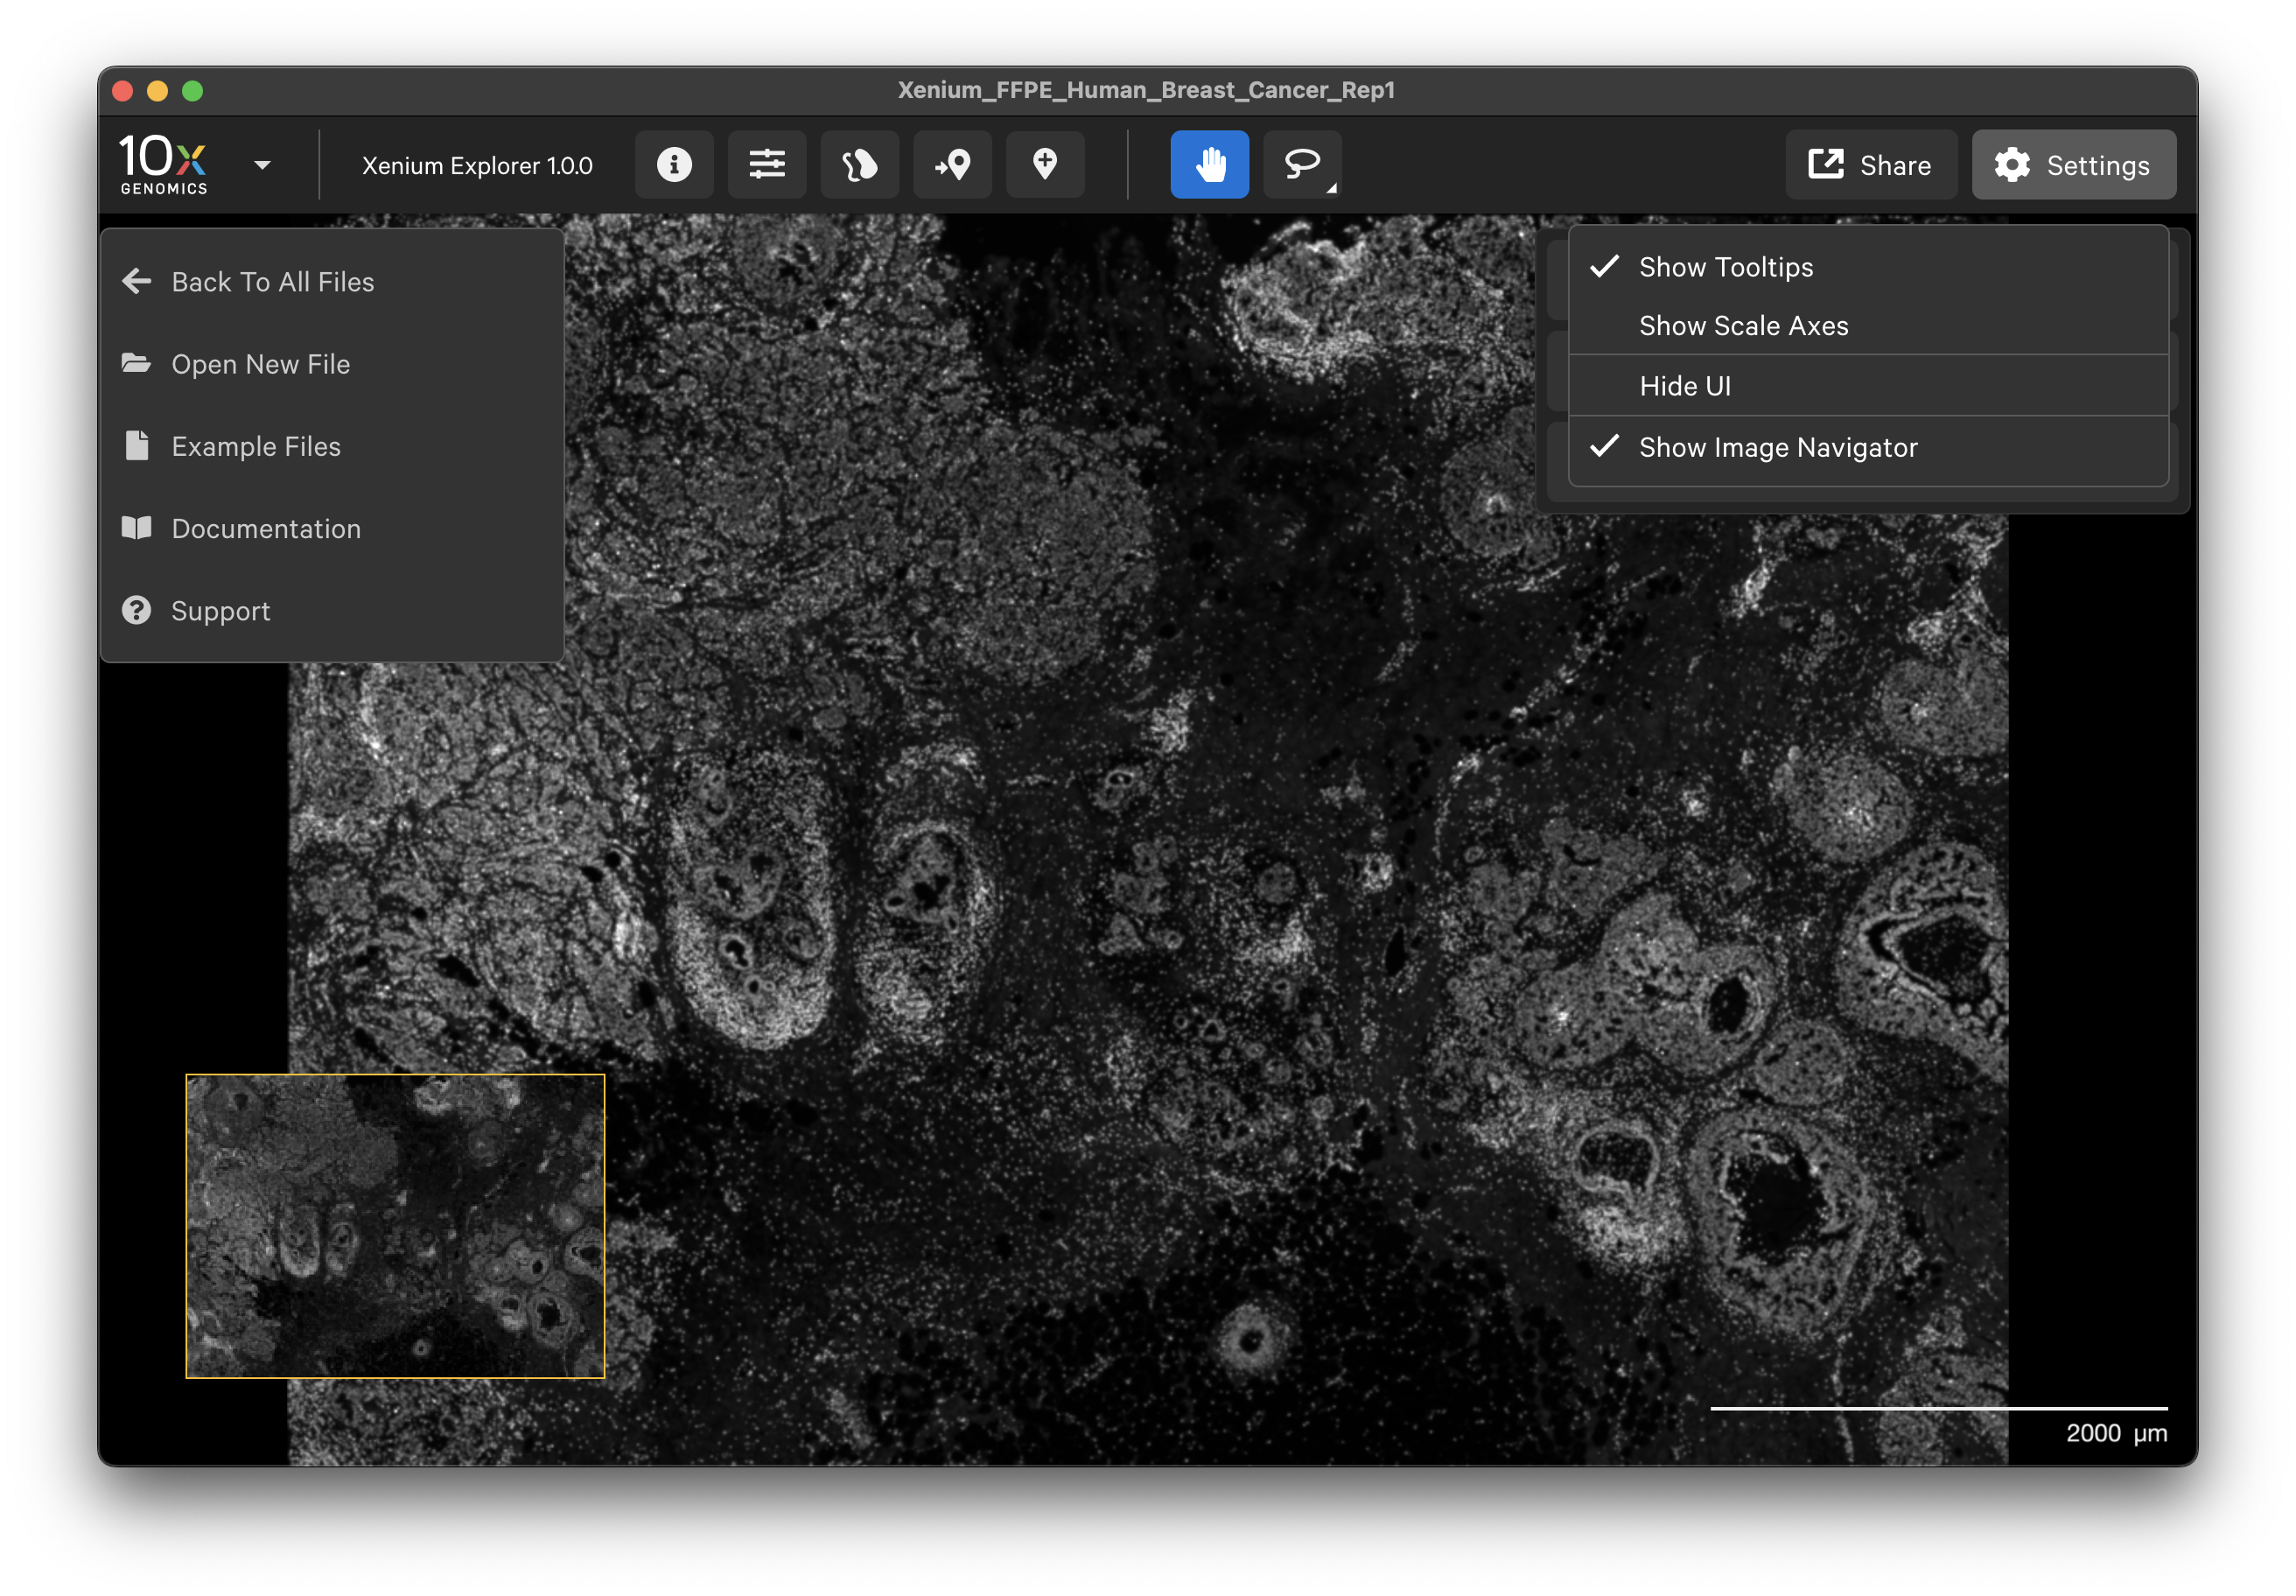
Click the 10x Genomics icon in the top left-hand corner to return to the home screen, open a new dataset, or find support documentation.
The Xenium Explorer interface settings are controlled in the Settings menu and with keyboard shortcuts. The Settings menu allows you to show or hide transcript and cell tooltips, image scale axes, the user interface (UI) itself, and the image navigator in the bottom left-hand corner.
Keyboard shortcuts:
| Key | Alternative | Description |
|---|---|---|
| Tab | Settings button | Show/hide UI |
| = (equals key) | Scroll with mouse | Zoom in |
| - (hyphen key) | Scroll with mouse | Zoom out |
| L | Lasso button | Draw a freehand shape with lasso selection tool |
| R | Lasso button | Draw a rectangle with selection tool |
| P | Pan button | Move the image up and down, or left and right |
Sample Information
The Sample Information pop-up window displays metadata about the sample run, analysis, and panel. The Run and Panel sections show information entered on the Xenium Analyzer instrument during the run set up; they are stored in the experiment.xenium manifest file. From the Analysis section, you can open the analysis summary HTML file in another Xenium Explorer window.
The Image, Cells, and Transcripts menus allow you to layer multiple pieces of information in the explorer viewing area. We will discuss the options for each layer below.
The Image menu shows settings to adjust the 3D image stack of the nuclei-stained (DAPI) cells.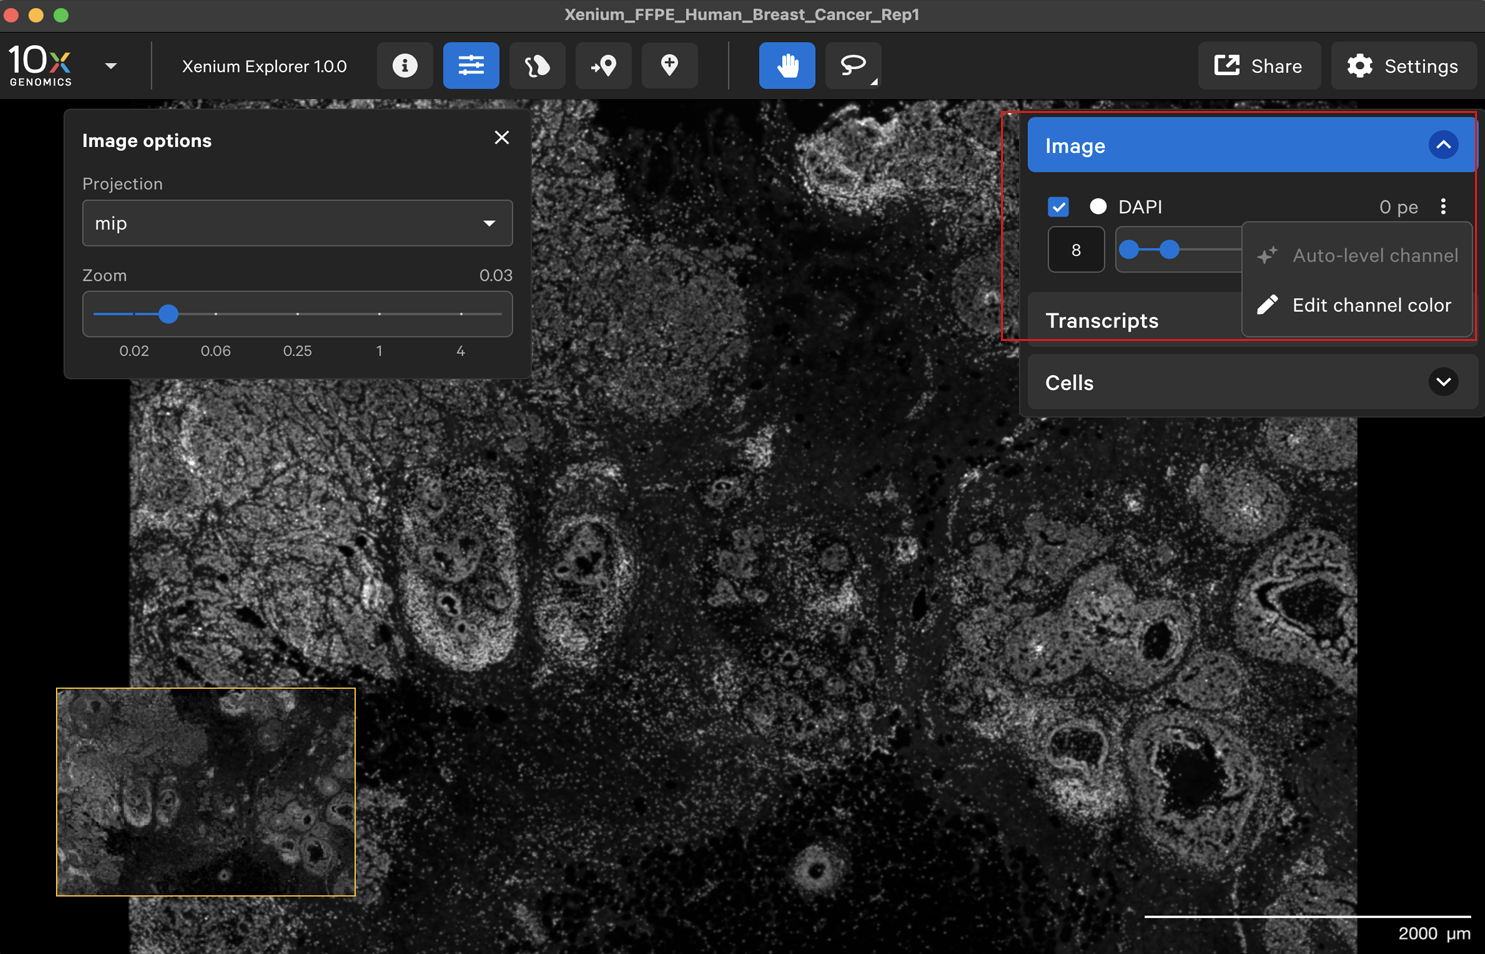
Image options
The Xenium Analyzer captures vertical stacks of images every cycle and in every channel for multiple fields of view. The stacks are processed and stitched together to build a single image of the tissue section. Xenium Explorer displays the X-Y dimensions of the image. The Image options panel allows you to explore the Z-dimension. The zoom slider controls zooming in/out on the image.
When “None” is selected as the projection, you can view images of the tissue from different Z-plane depths. The Z-slice depth in μm is shown in the lower left-hand corner. Zoom in to a region of the image, and click through different Z-slices. The nuclei should look fuzzy, come into focus, and then go out of focus again as you sweep through the Z-plane of that region of the tissue. This feature can be useful for examining cell structure within the tissue volume.
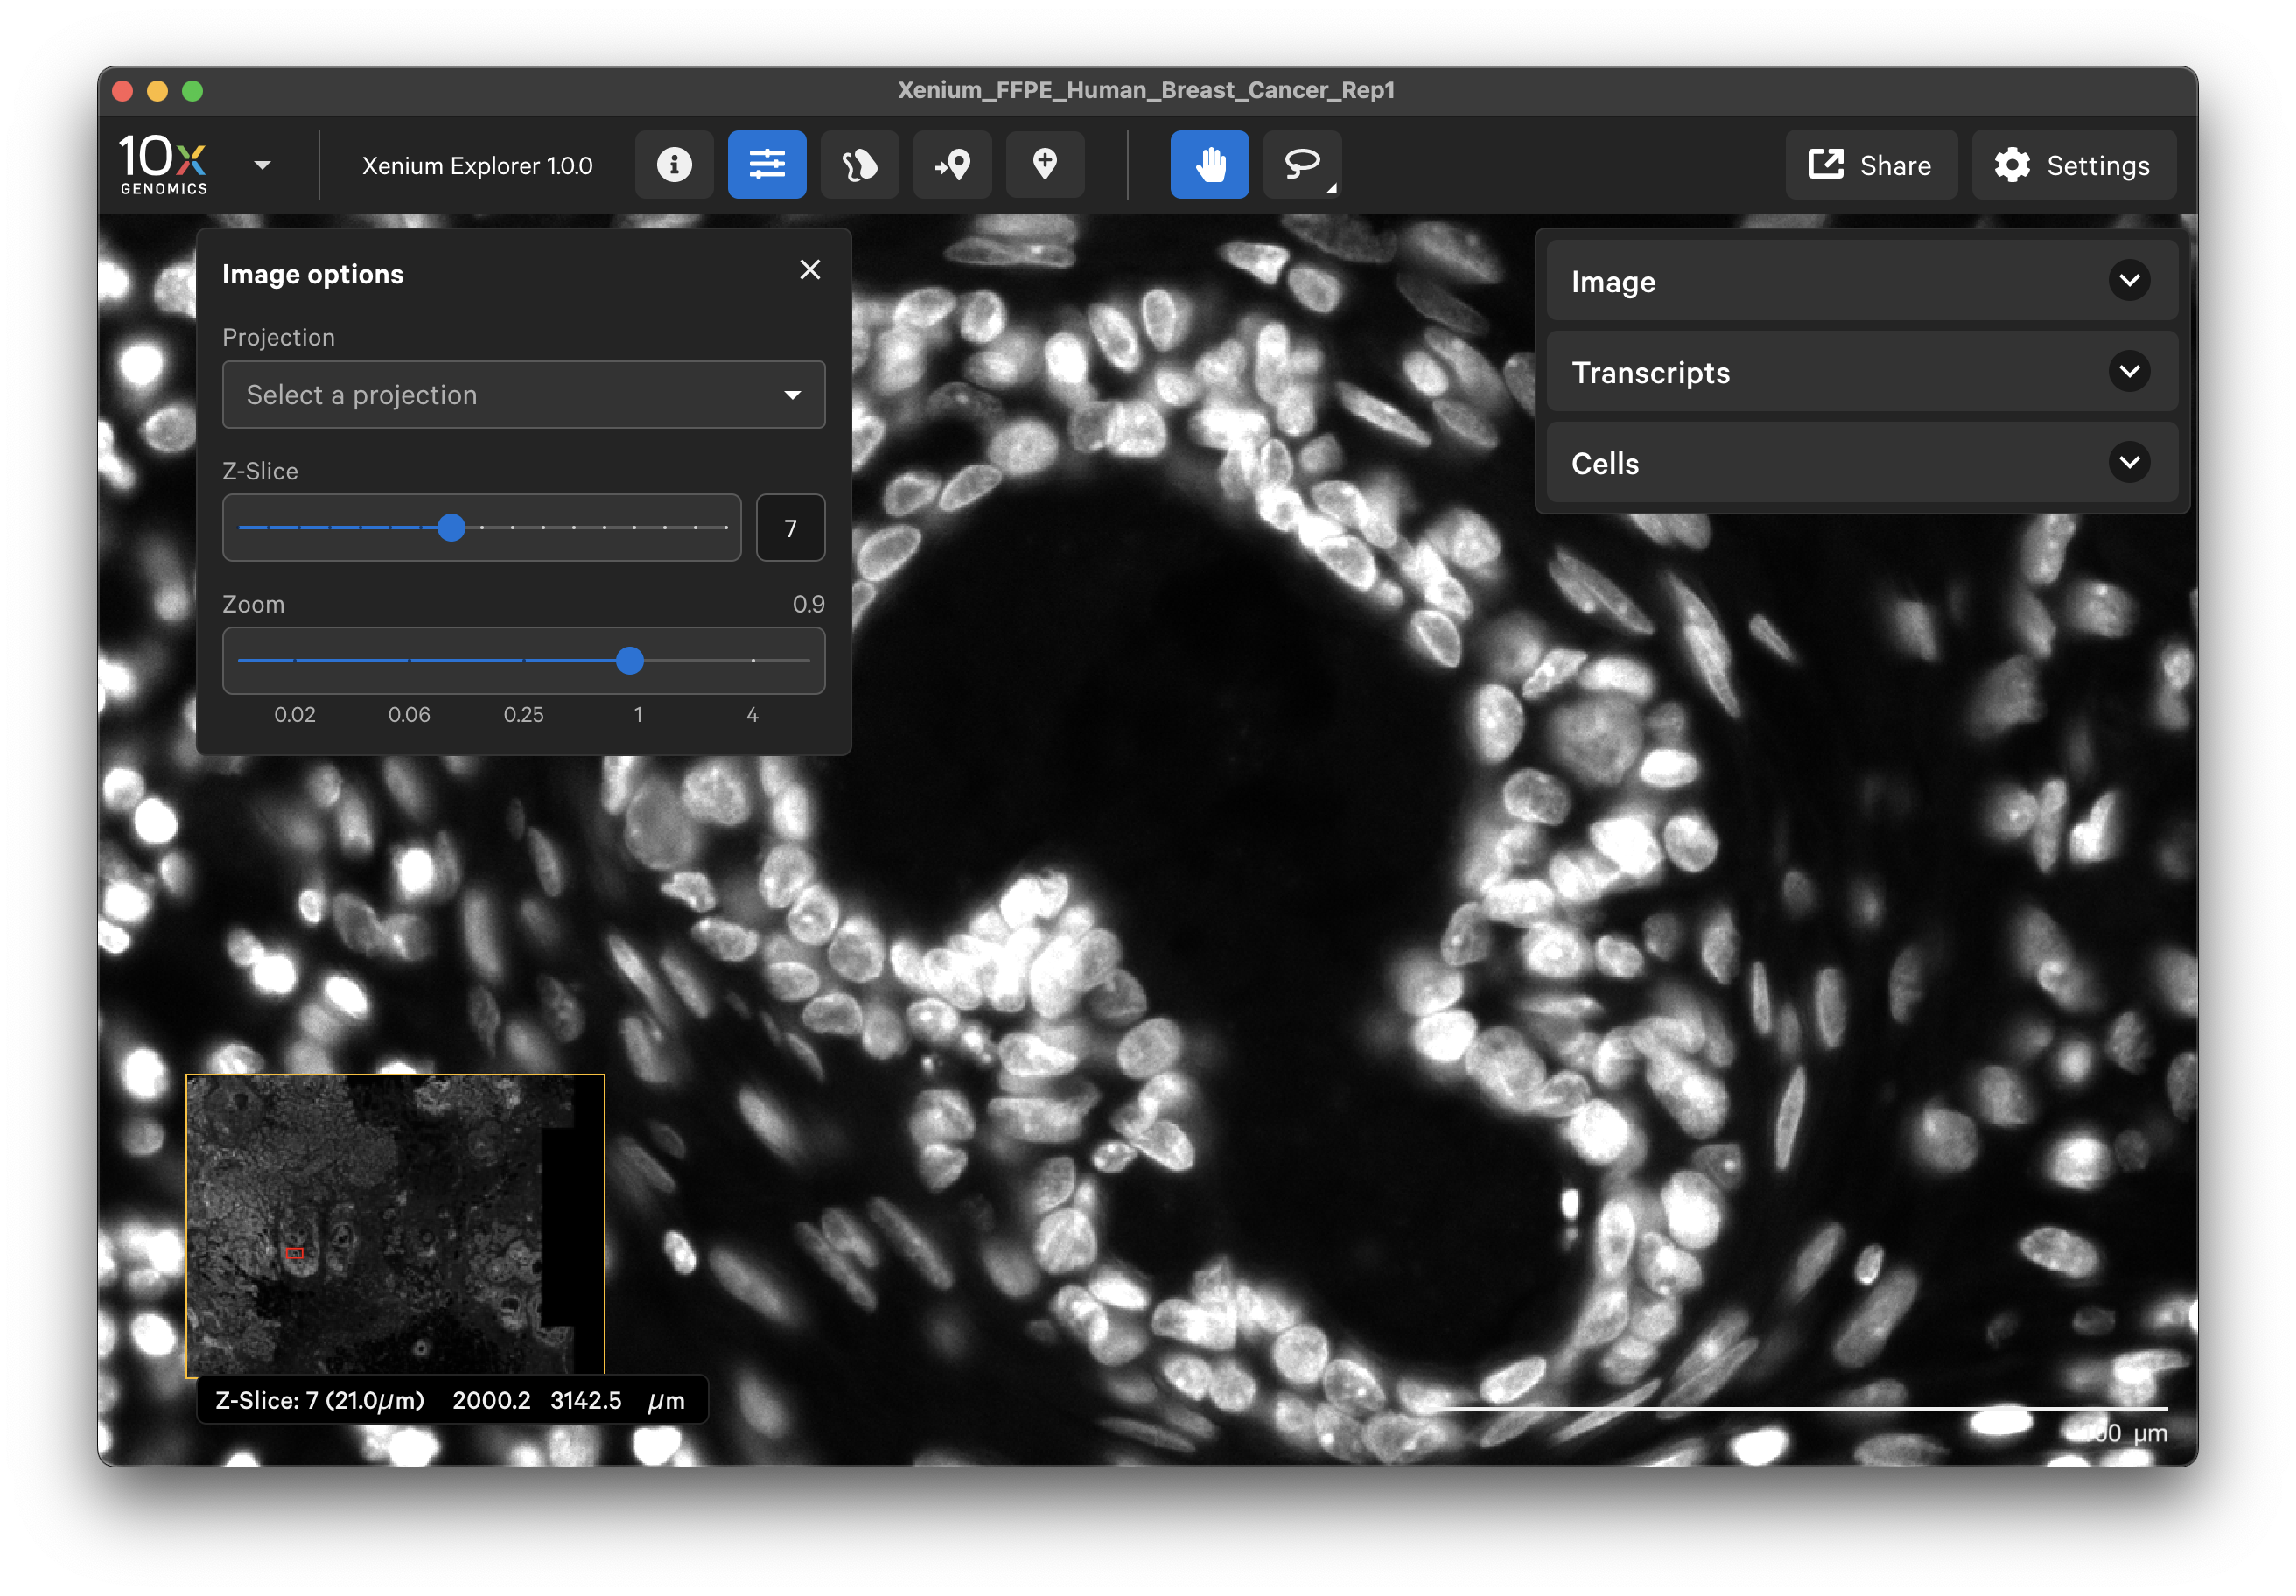
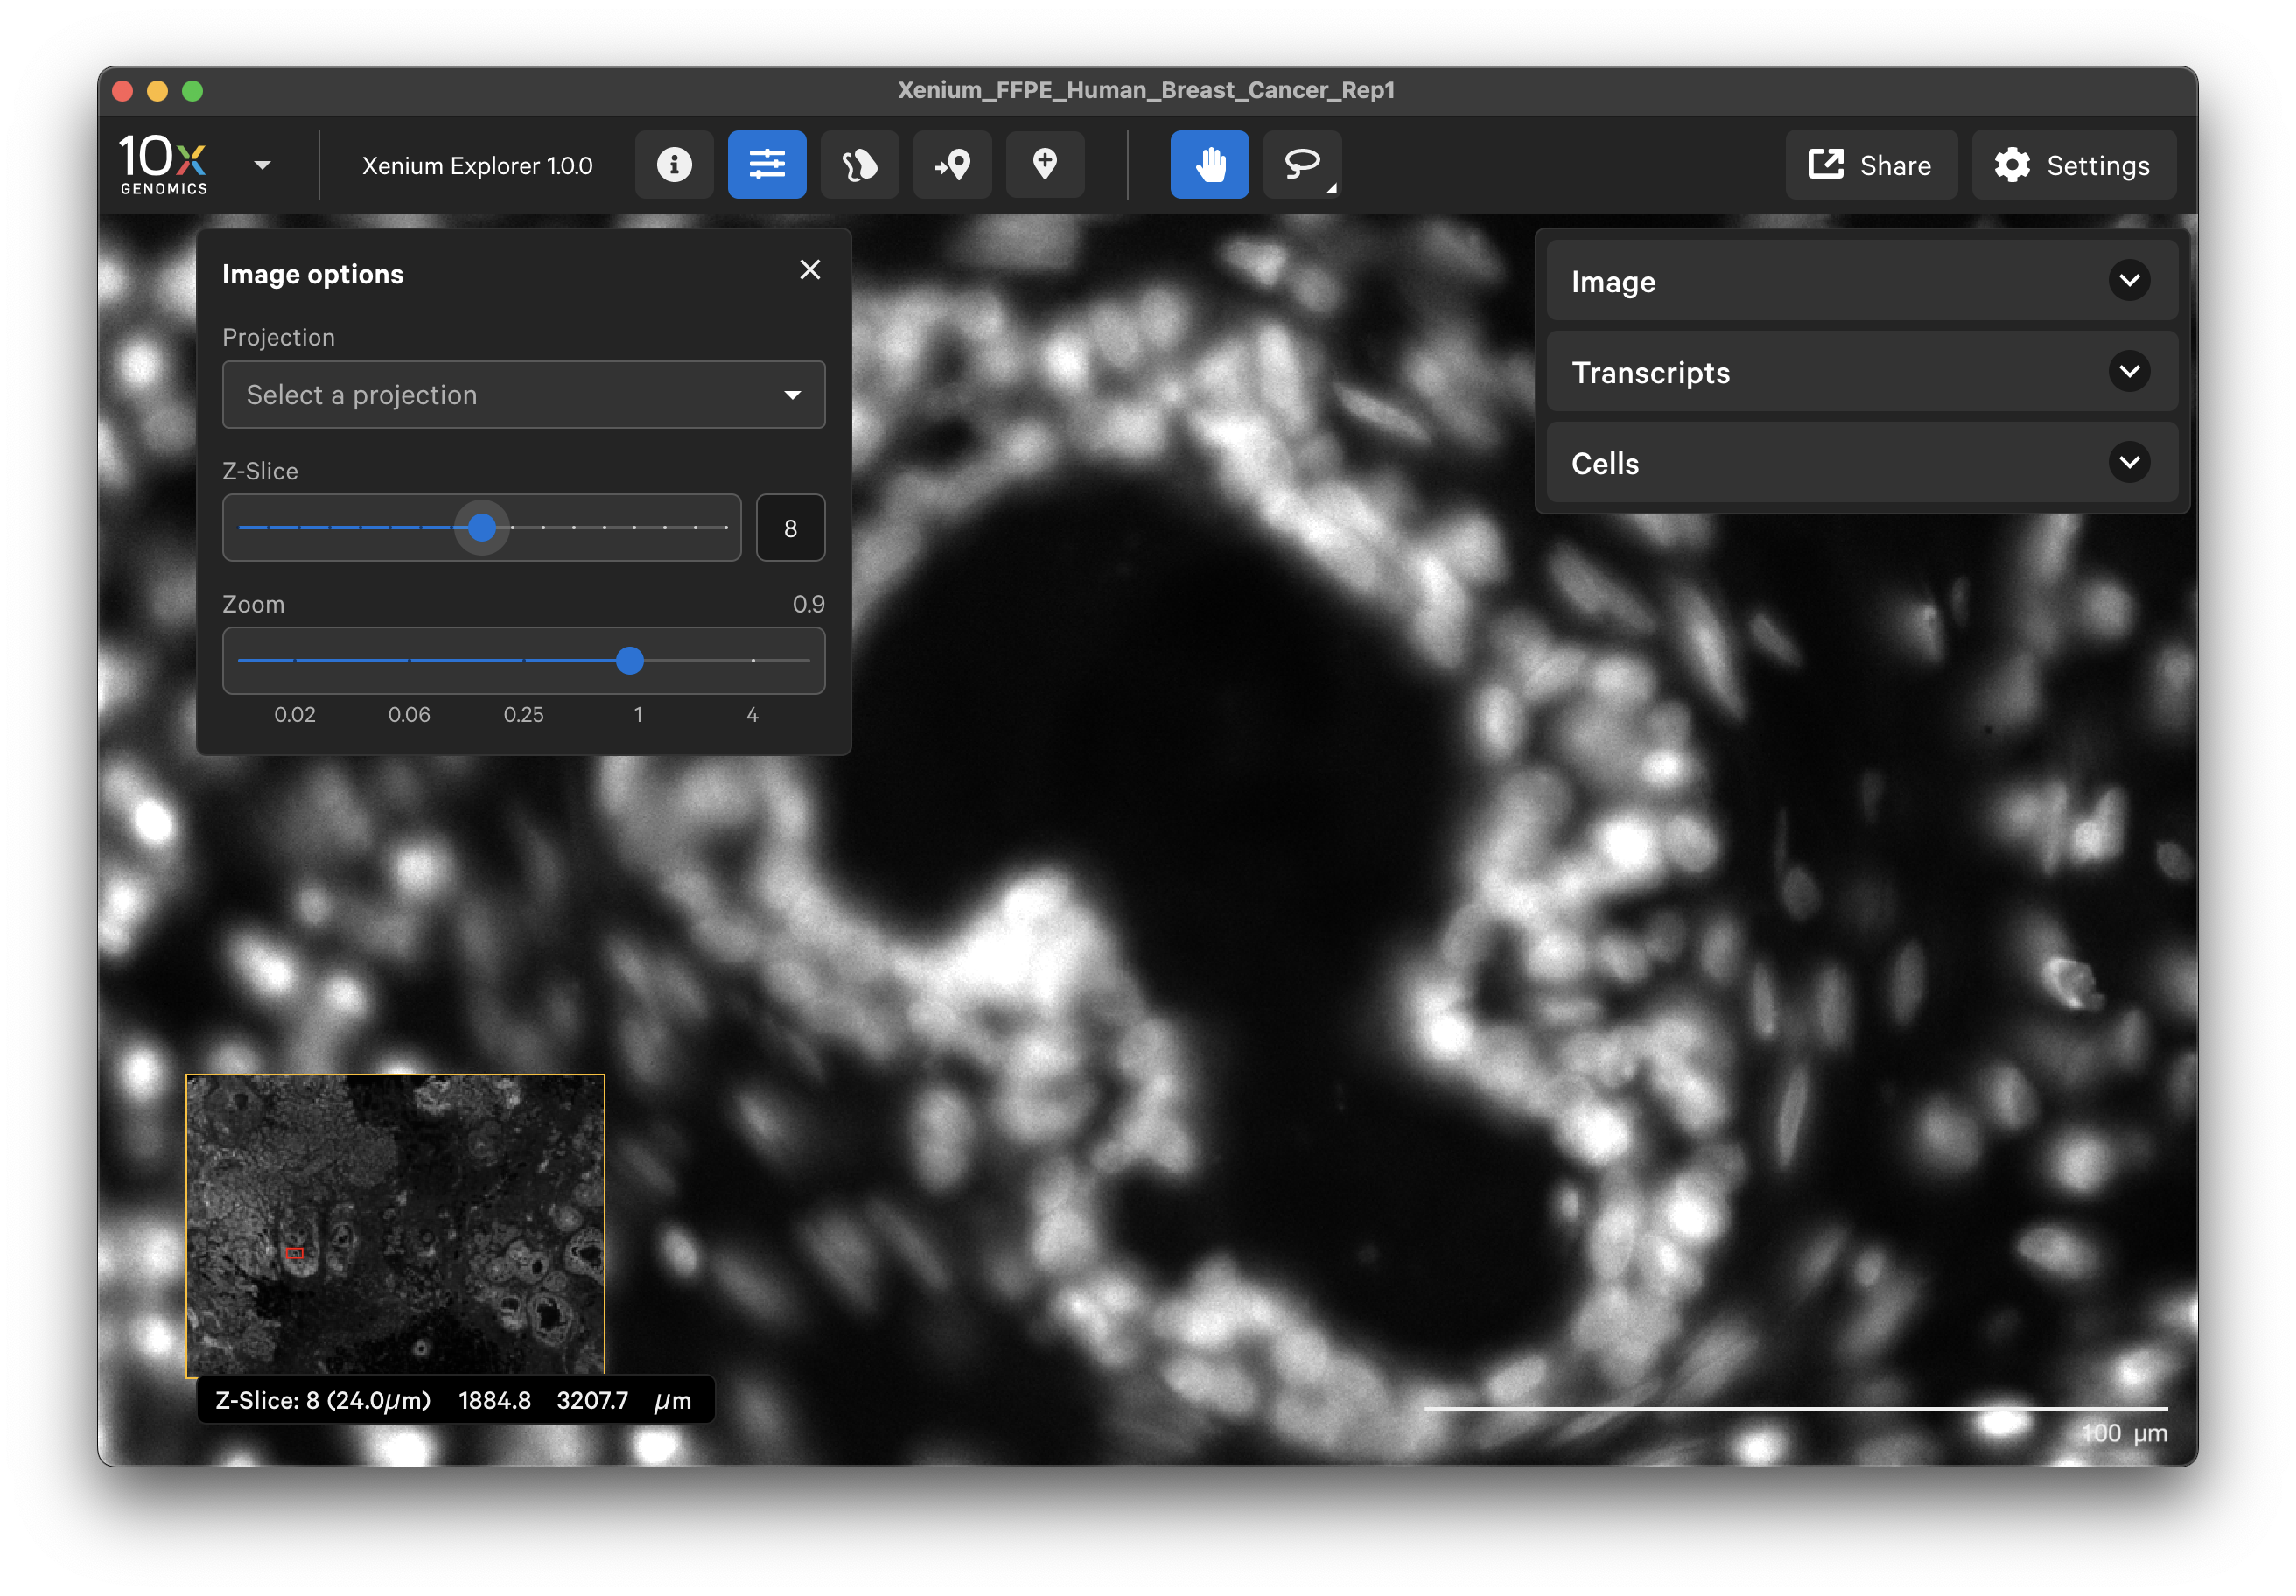
The default image display option uses the maximum intensity projection (“mip”) of the DAPI Z-stack image (morphology_mip.ome.tif file). The maximum intensity projection technique converts a 3-dimensional stack of microscope images into a 2-dimensional image. It displays the brightest pixel from each layer. All the cells will be visible, however there may be higher background from out-of-focus light.
The “focus” option displays the single best-focus Z-plane from the DAPI Z-stack image (morphology_focus.ome.tif file). The background is minimized in this image. It works best for cells in the tissue that approximate a monolayer, while cells above or below the focal Z-plane may be missed.
Image menu
You can change the image contrast with the slider. The channel color can be changed either by clicking the three vertical dots or the current color circle. The contrast is auto-leveled by default; click the three dots and select Auto-level channel to reset.
The Cells menu displays nuclei and cell borders based on cell segmentation results. The cell boundaries can be viewed as an outlined or filled cell. Nuclei outlines may also be toggled on and off. This feature is useful for checking cell segmentation quality (see Checking Xenium Data Quality tutorial).
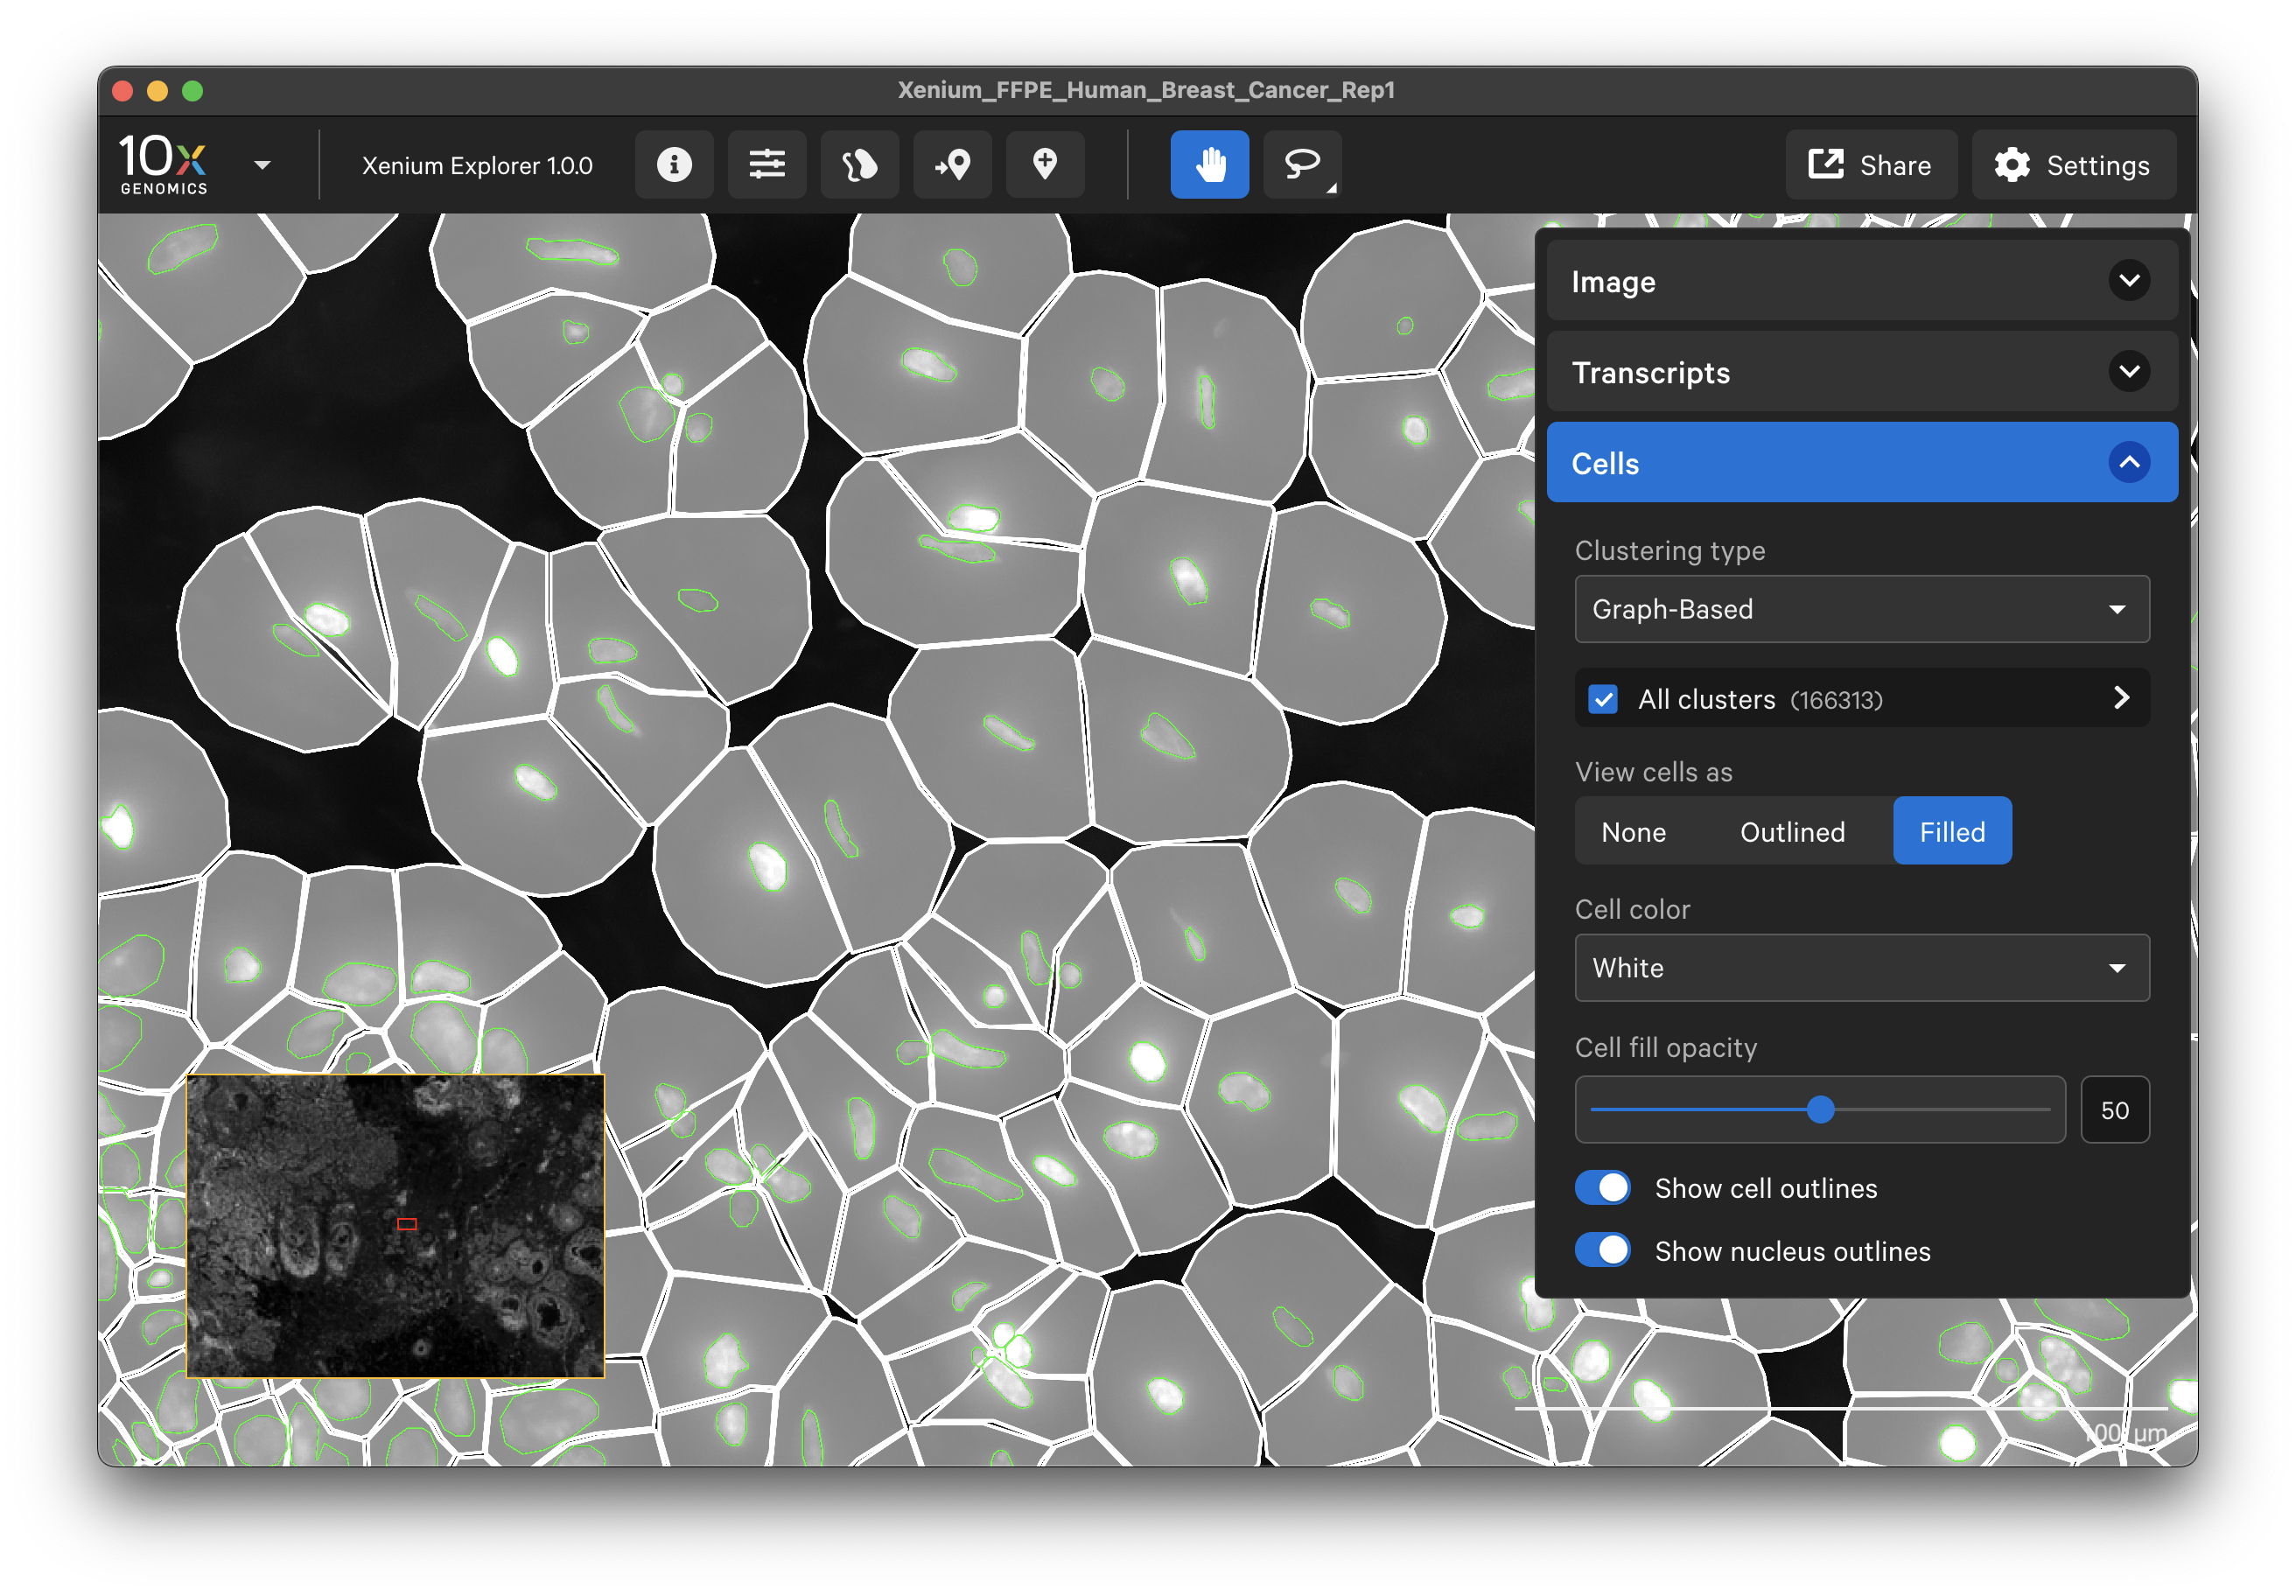
When tooltips are shown (Settings > Show ToolTips), you will see cluster, location, area, and transcript counts for individual cells as you move the cursor over each cell.
Cells by transcript density
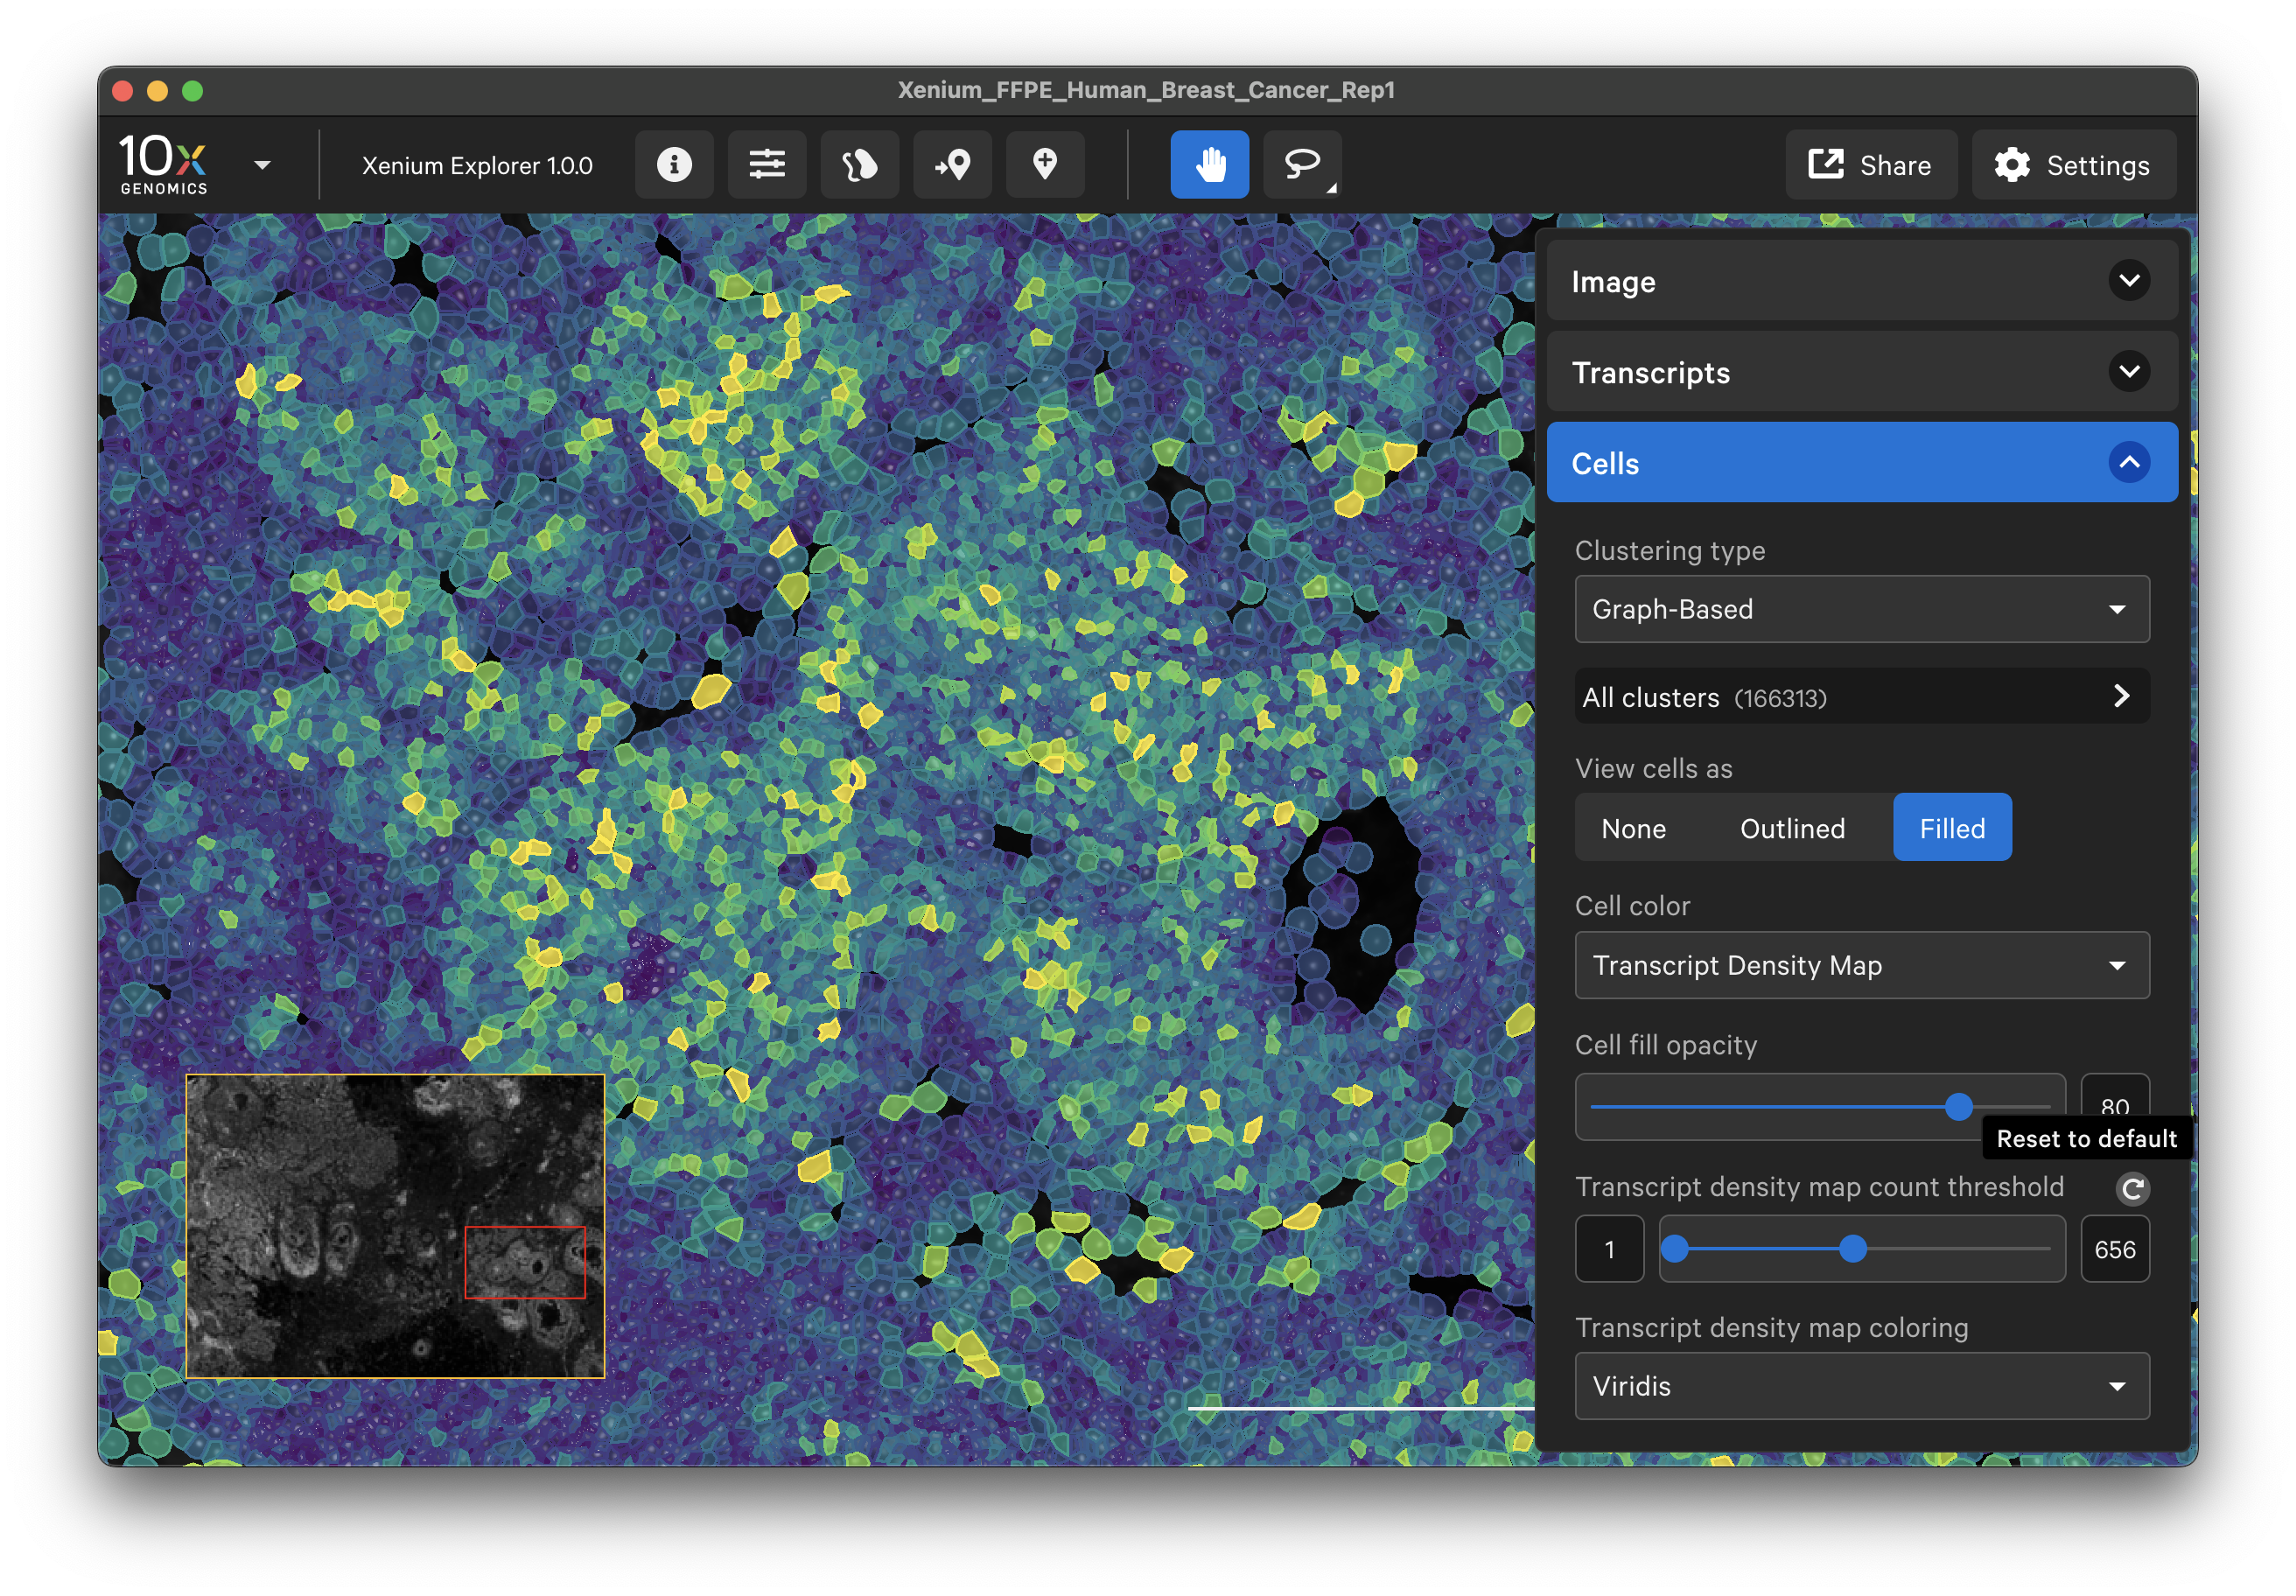
Cells can be colored by transcript density or cluster affiliation. The transcript density is determined by the genes that are selected on the Transcripts menu. Cell colormap lower/upper bounds and fill opacity can be adjusted with the slider (click arrow above maximum threshold value to reset). There are several color palette options.
When colored by the transcript density map, the lowest transcript density cell maps to the lower end of the palette (i.e., viridis=purple), while the highest transcript density cell maps to the upper end of the palette (i.e., viridis=yellow), with a linear distribution in between. The Transcript density map count threshold slider allows you to choose a different mapping range, which can help to visualize cells that are at or beyond the limits of the density range.
Cell clusters
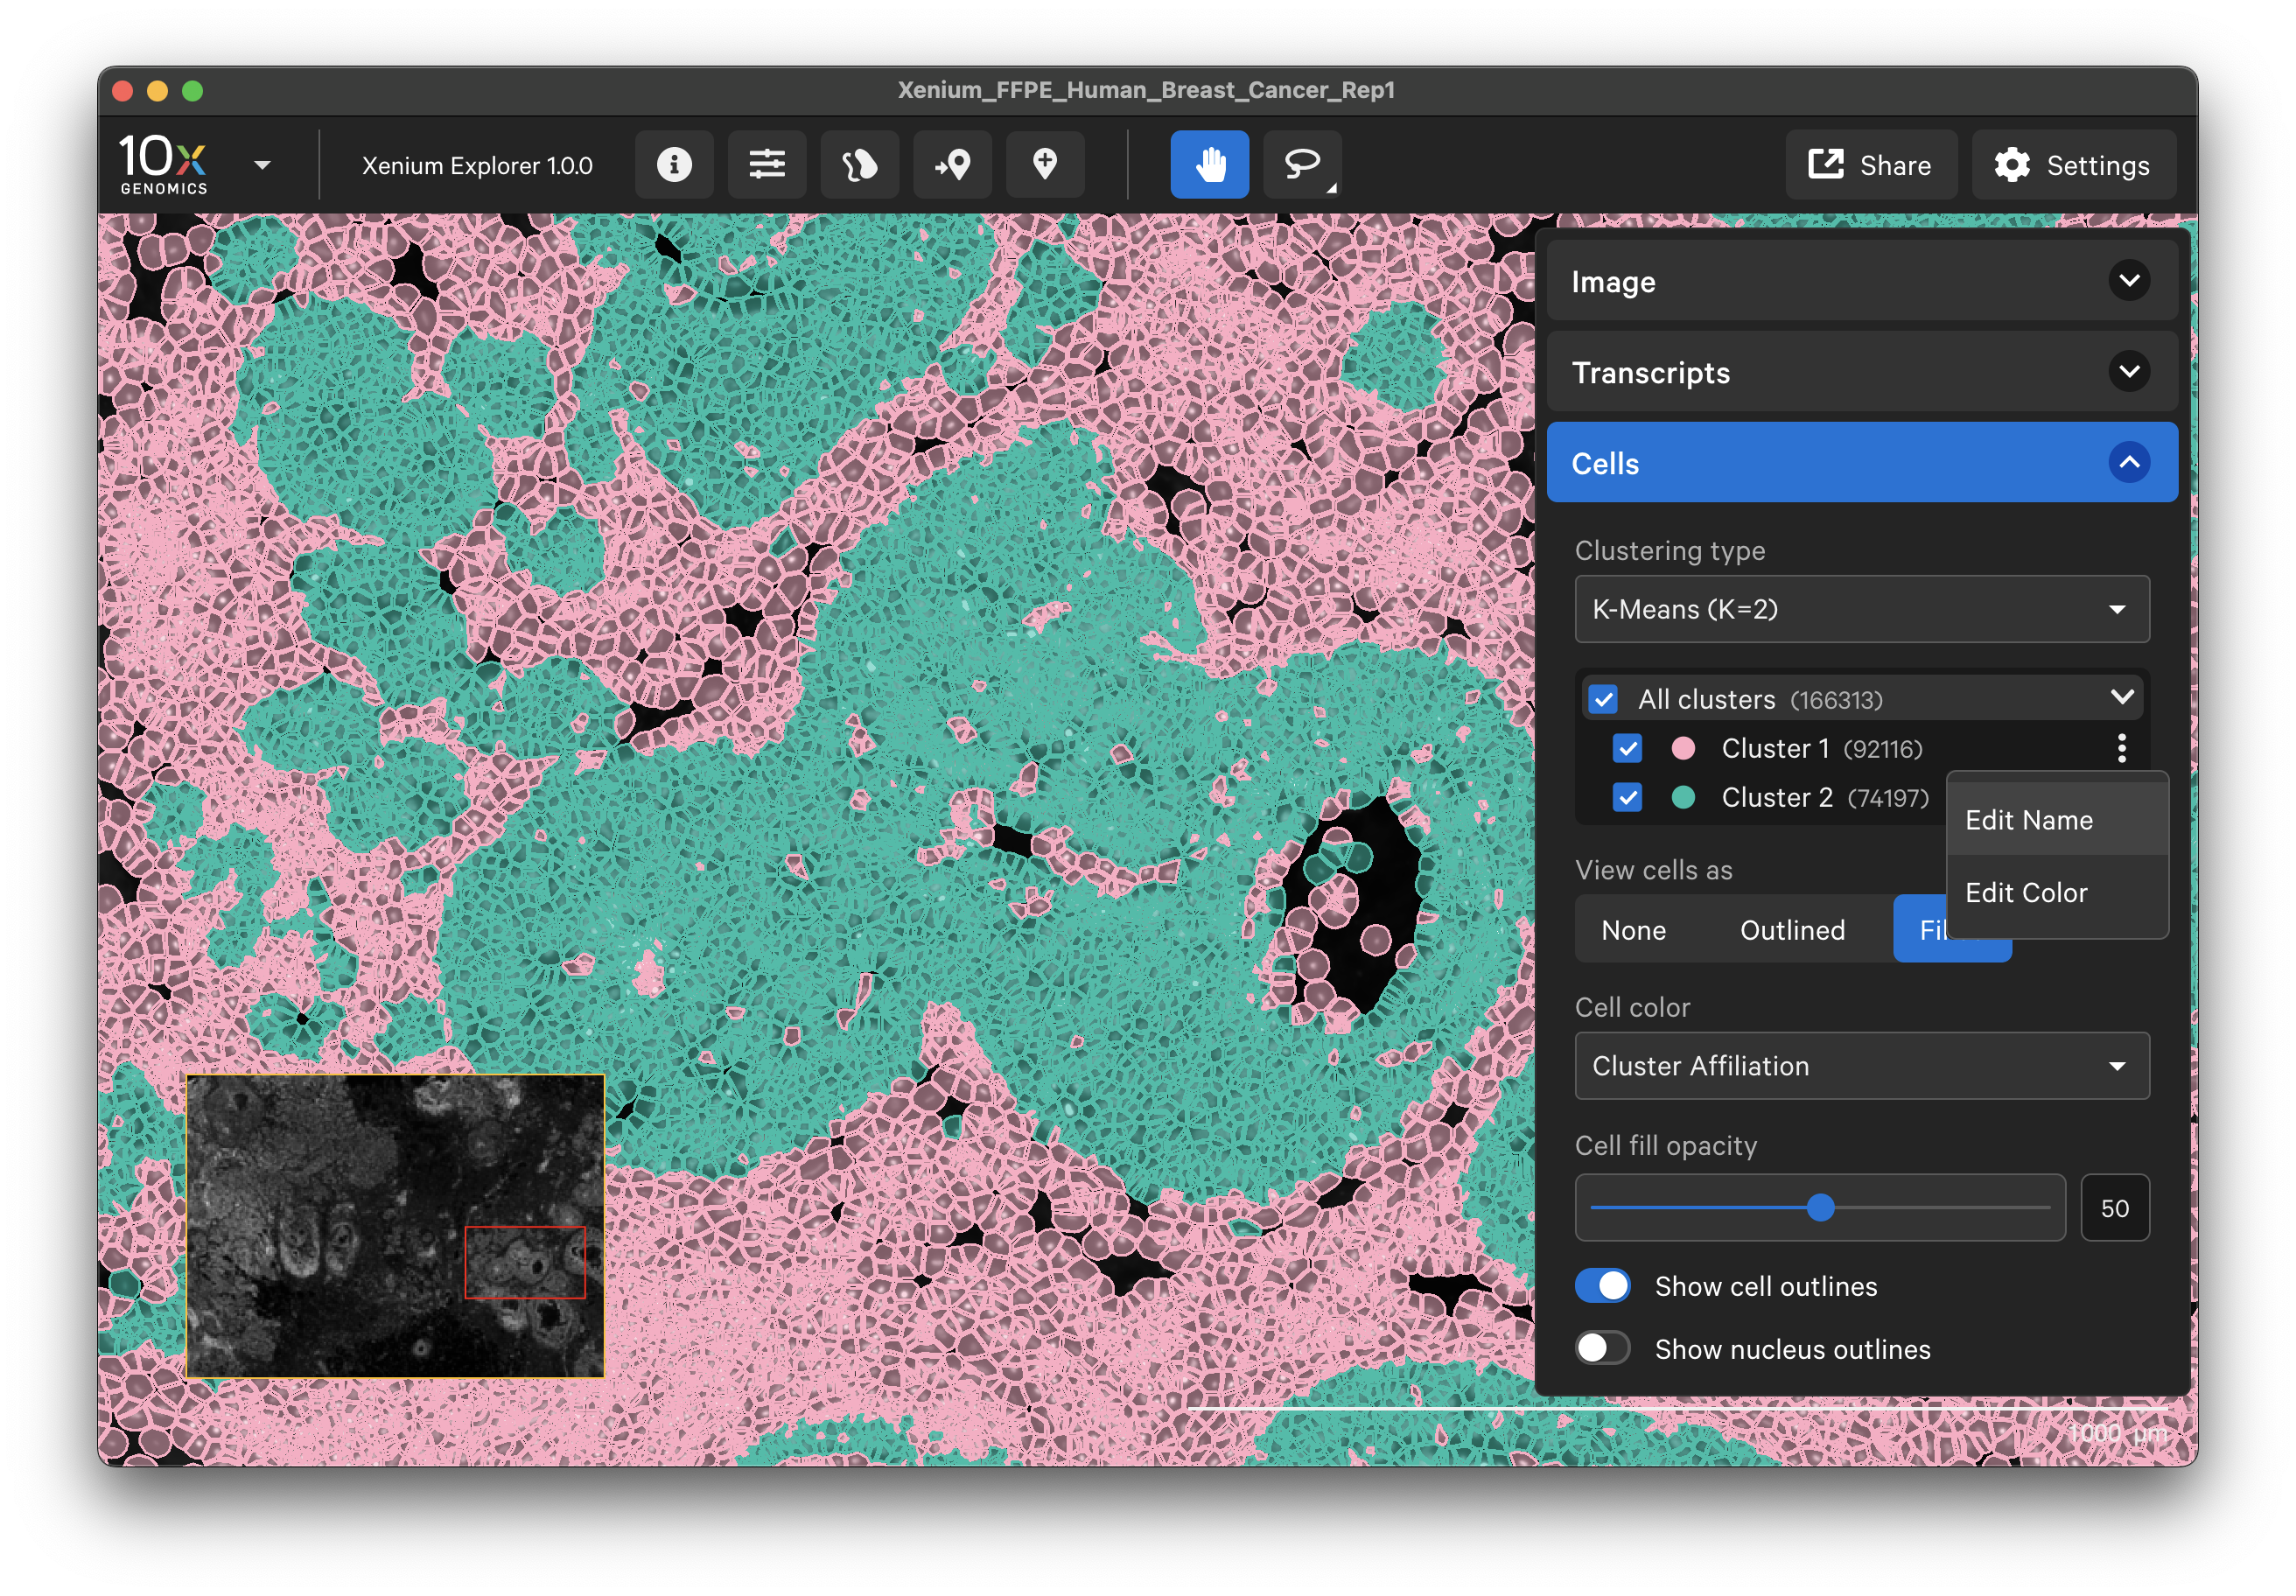
The Cells menu also shows cells colored by pre-computed graph-based or K-means cluster groups. The clusters are generated by the Xenium Analyzer pipeline and are stored in the analysis.zarr.zip file. This feature is useful for assessing whether cell clusters align with known cell types or regions of interest in the sample (see Checking Xenium Data Quality tutorial).
The cluster name and color can be edited by clicking the three vertical dots next to each cluster label. You can reset the original cluster color or name by selecting the Edit Color or Edit Name and Reset to default. The clusters can be renamed based on cell type annotation using marker genes.
The Transcript menu displays transcript count data. When tooltips are shown (Settings > Show ToolTips), you will see ID, location, and Q-Score for individual transcripts as you move the cursor over each transcript point.
By default, the full gene panel will be displayed in the Transcripts menu. You can look for a specific transcript in the gene panel search bar or organize the genes by group labels.
Creating gene groups
First, decide which genes you want to create groups for. The cell_feature_matrix/features.tsv.gz file in the output directory contains the full list of pre-designed panel genes, as well as any custom add-on genes. For each feature, the Ensembl ID and gene name are stored in the first and second column of the features.tsv.gz file, respectively. The third column identifies the feature type (Gene Expression). You can copy/paste a list of Gene Expression genes from the second column of this file. Xenium Explorer does not use the negative control rows (Negative Control Probe, Negative Control Codeword, Blank Codeword); they are used for calibration during the on-instrument analysis.
# to view the file
gzip -cd features.tsv.gz | less
# to uncompress the file
gunzip features.tsv.gz
Example:
ENSG00000121270 ABCC11 Gene Expression
ENSG00000107796 ACTA2 Gene Expression
ENSG00000163017 ACTG2 Gene Expression
ENSG00000168615 ADAM9 Gene Expression
ENSG00000123146 ADGRE5 Gene Expression
ENSG00000196616 ADH1B Gene Expression
ENSG00000181092 ADIPOQ Gene Expression
[...]
Next, create a gene group comma-separated value (CSV) file in a text editor, such as Microsoft Excel. The format of the CSV file is as follows:
- The first row should not be a column header name.
- The first column is a list of gene names.
- The second column is a list of group labels. The CSV file may contain an arbitrary number of columns for other group labels.
Example: 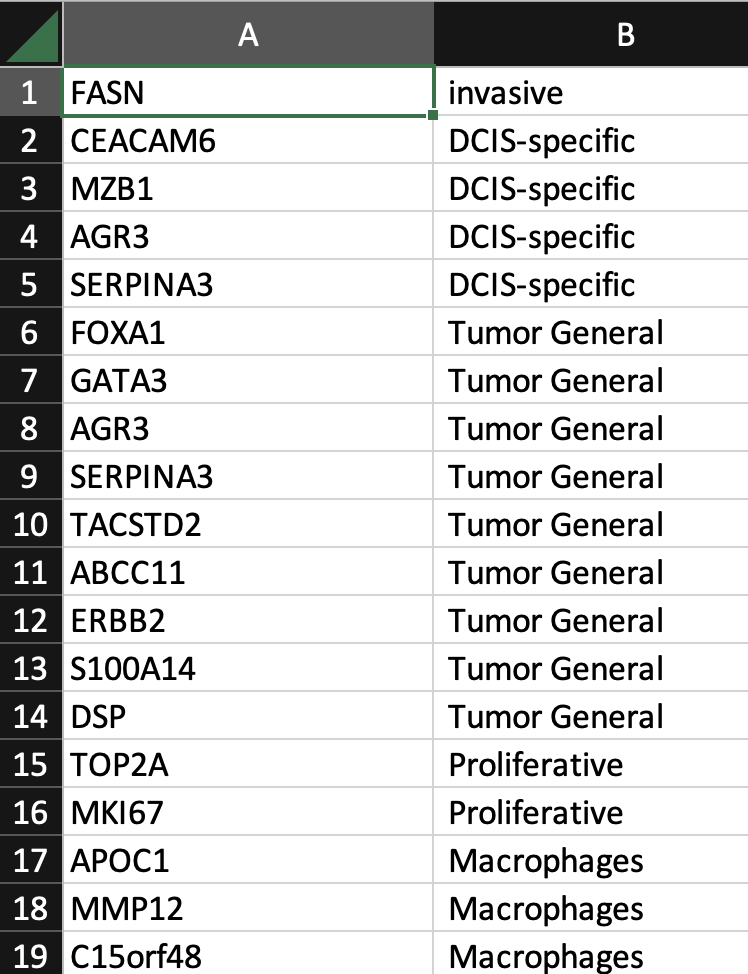
Next, click the three vertical dots and select Create gene groups. Click Upload Gene Group CSV and choose your CSV file. 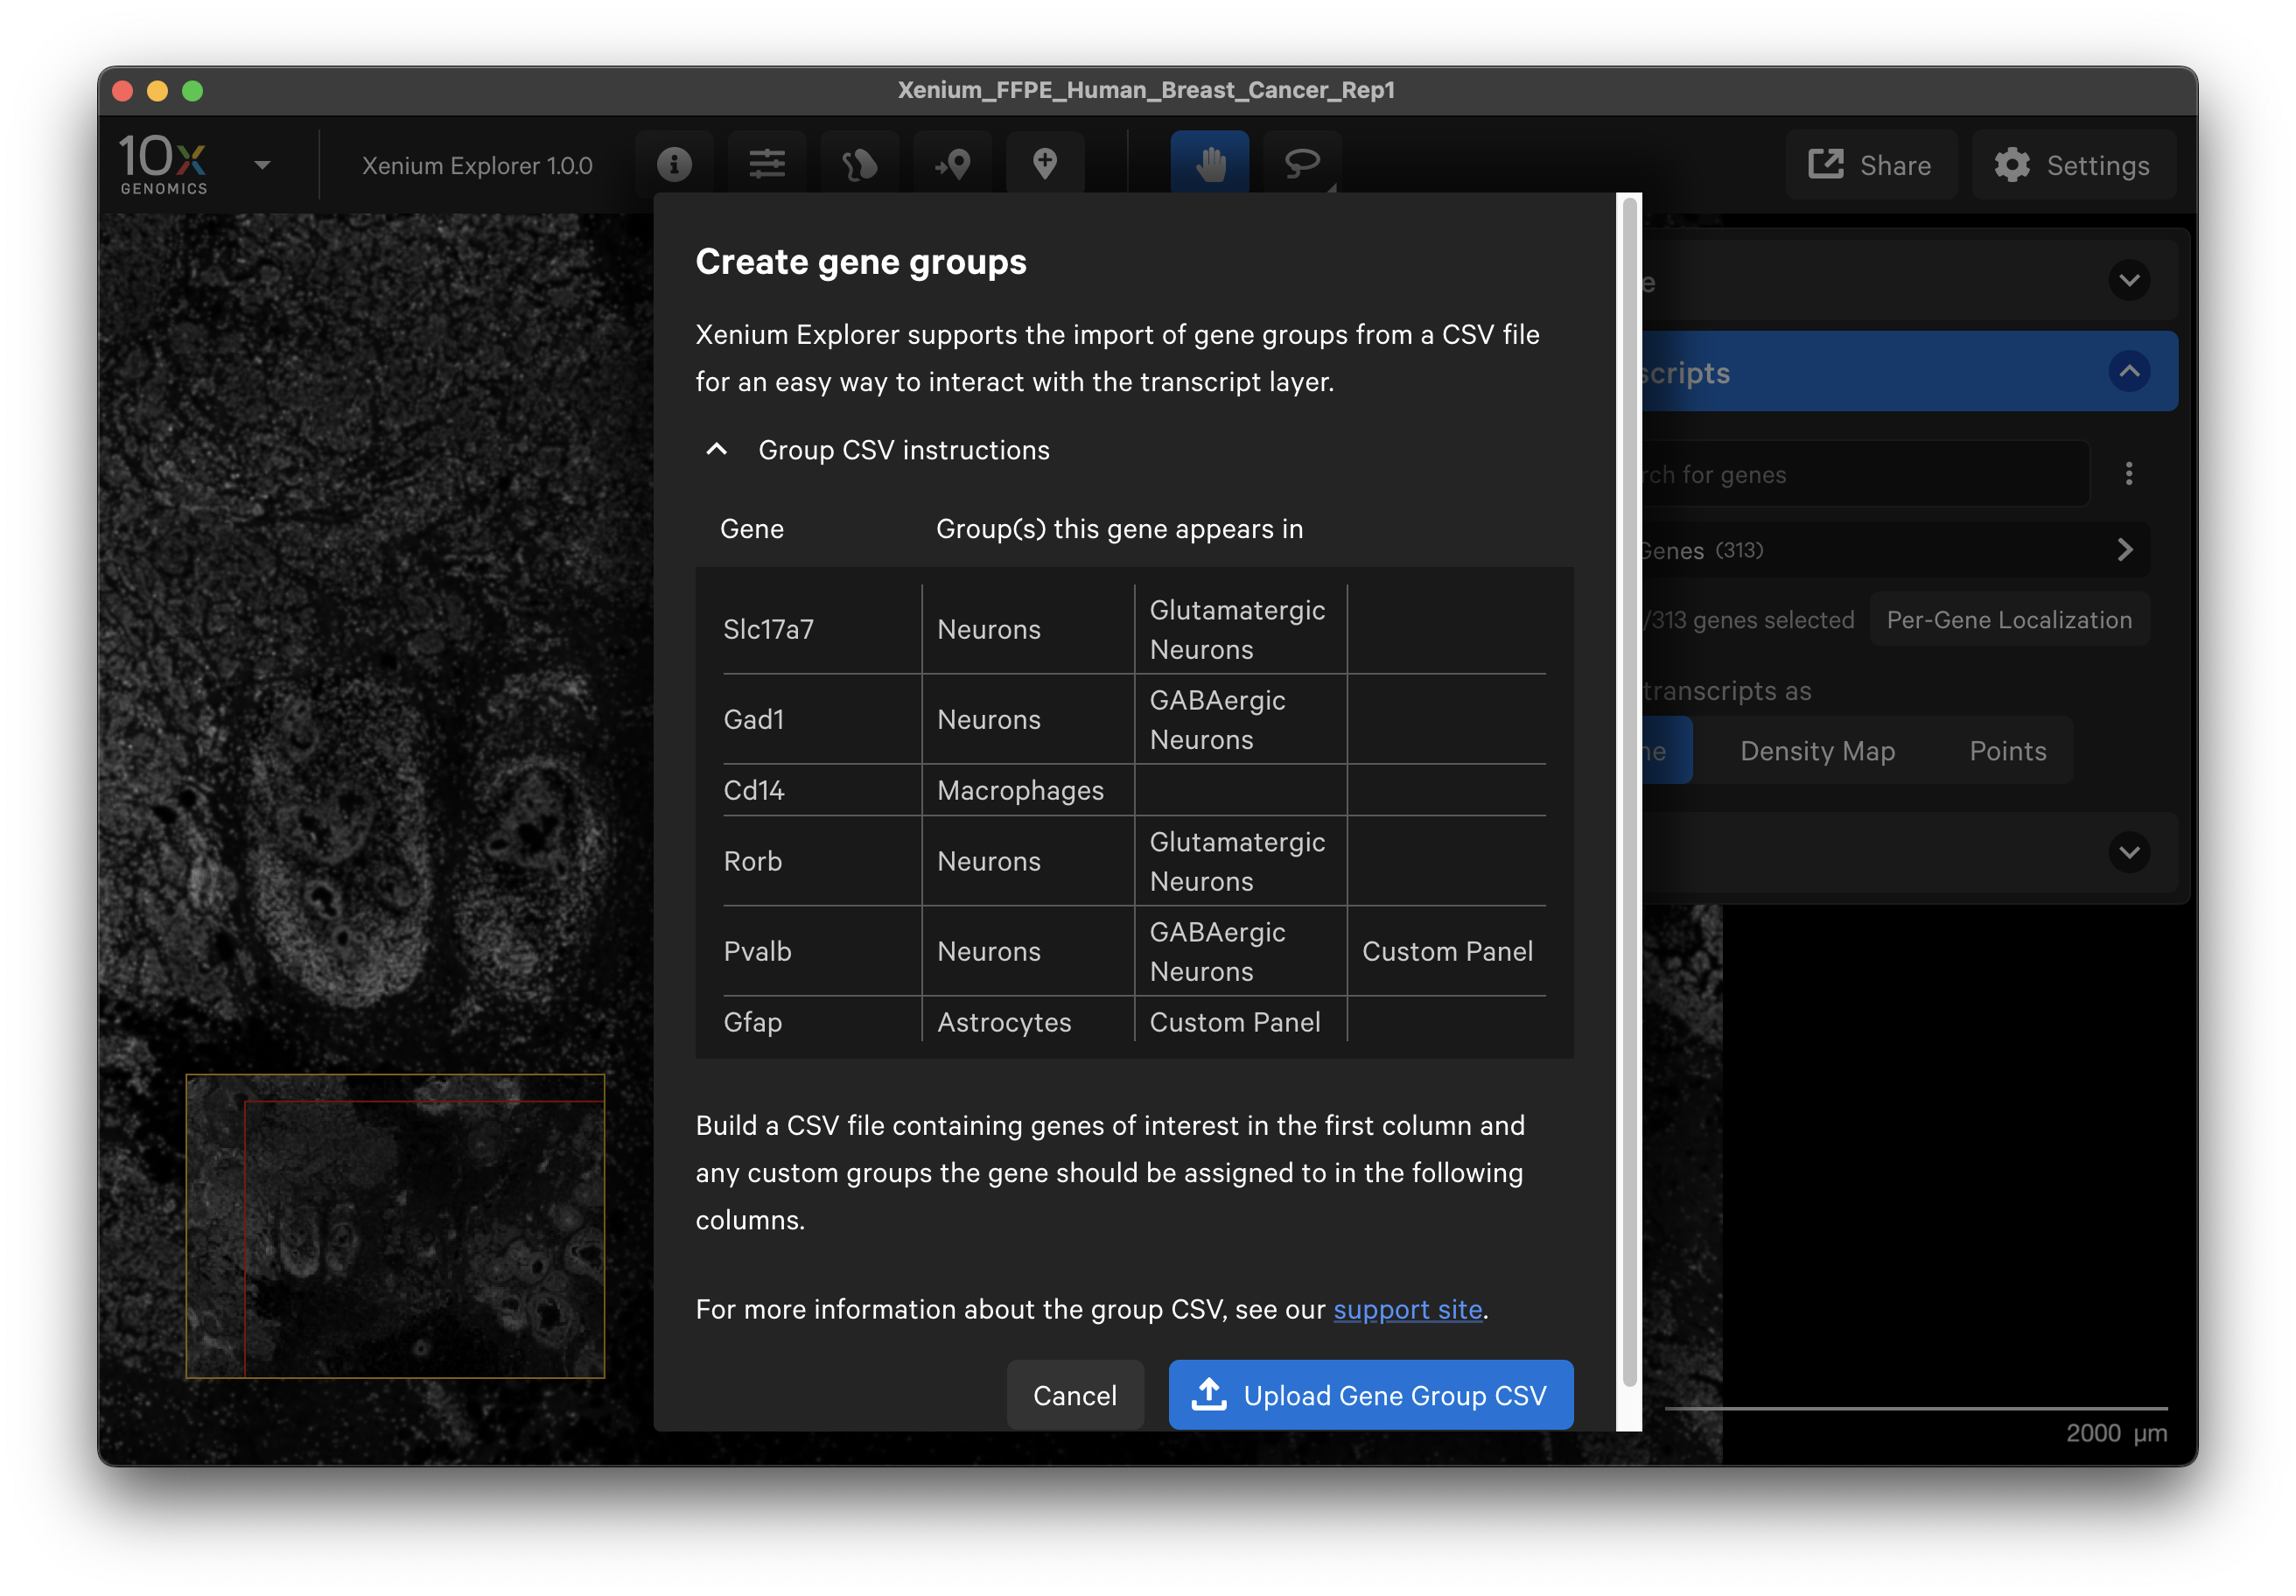
The gene list will now display the group names with drop-down menus. Grouped genes are automatically assigned the same point color. If panel genes were not included in the CSV file, they will be automatically grouped into an “Ungrouped” category. Ungrouped genes have a gray circle icon by default.
If the CSV file contains multiple group name columns, all group names will be listed alphabetically. Individual genes may be assigned to multiple groups and will be listed under each group name.
Transcript display options
Transcript counts can be shown as points or as a density map.
When displayed as points, checked gene icons will be visible in the viewing area and unchecked genes will be invisible. Low quality transcripts (Q score < 20) are filtered out by default. Switch the toggle to display them as gray circles (note: these are not the same as “Ungrouped” gene gray icon points). The individual transcript or gene group icon and color can be changed. You can reset to the original (prior to creating grouped genes) point color and icon by selecting Reset to default.
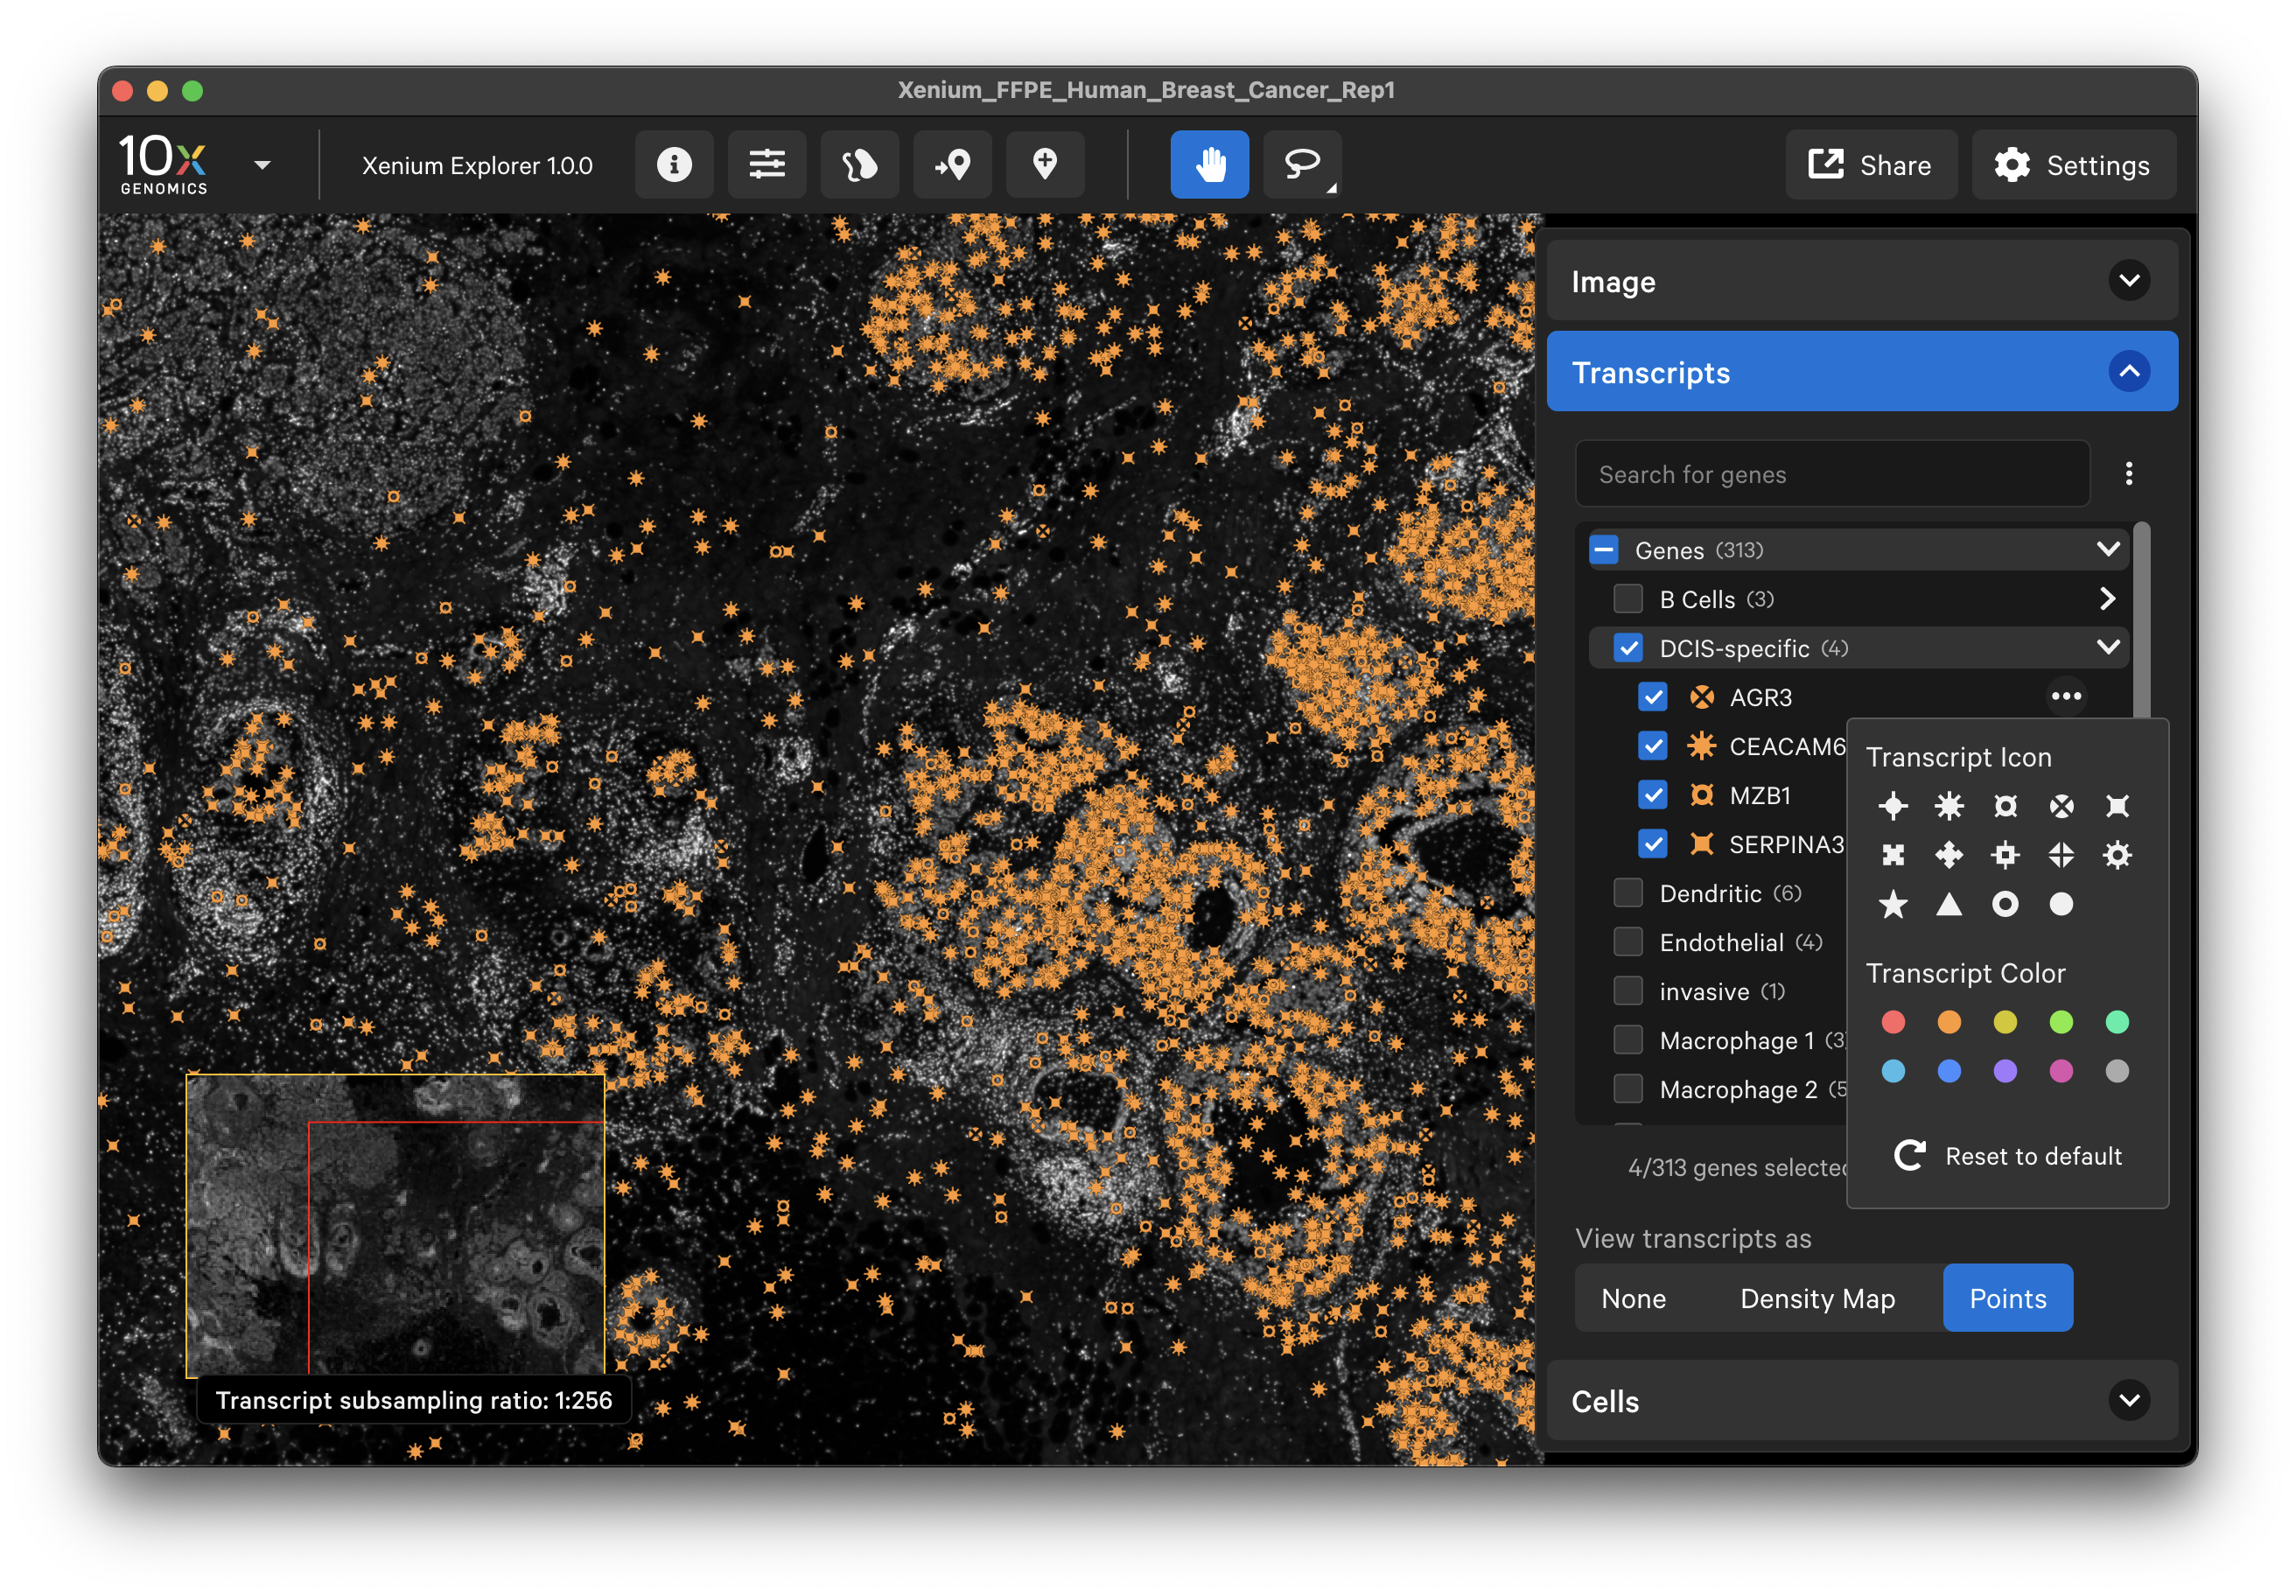
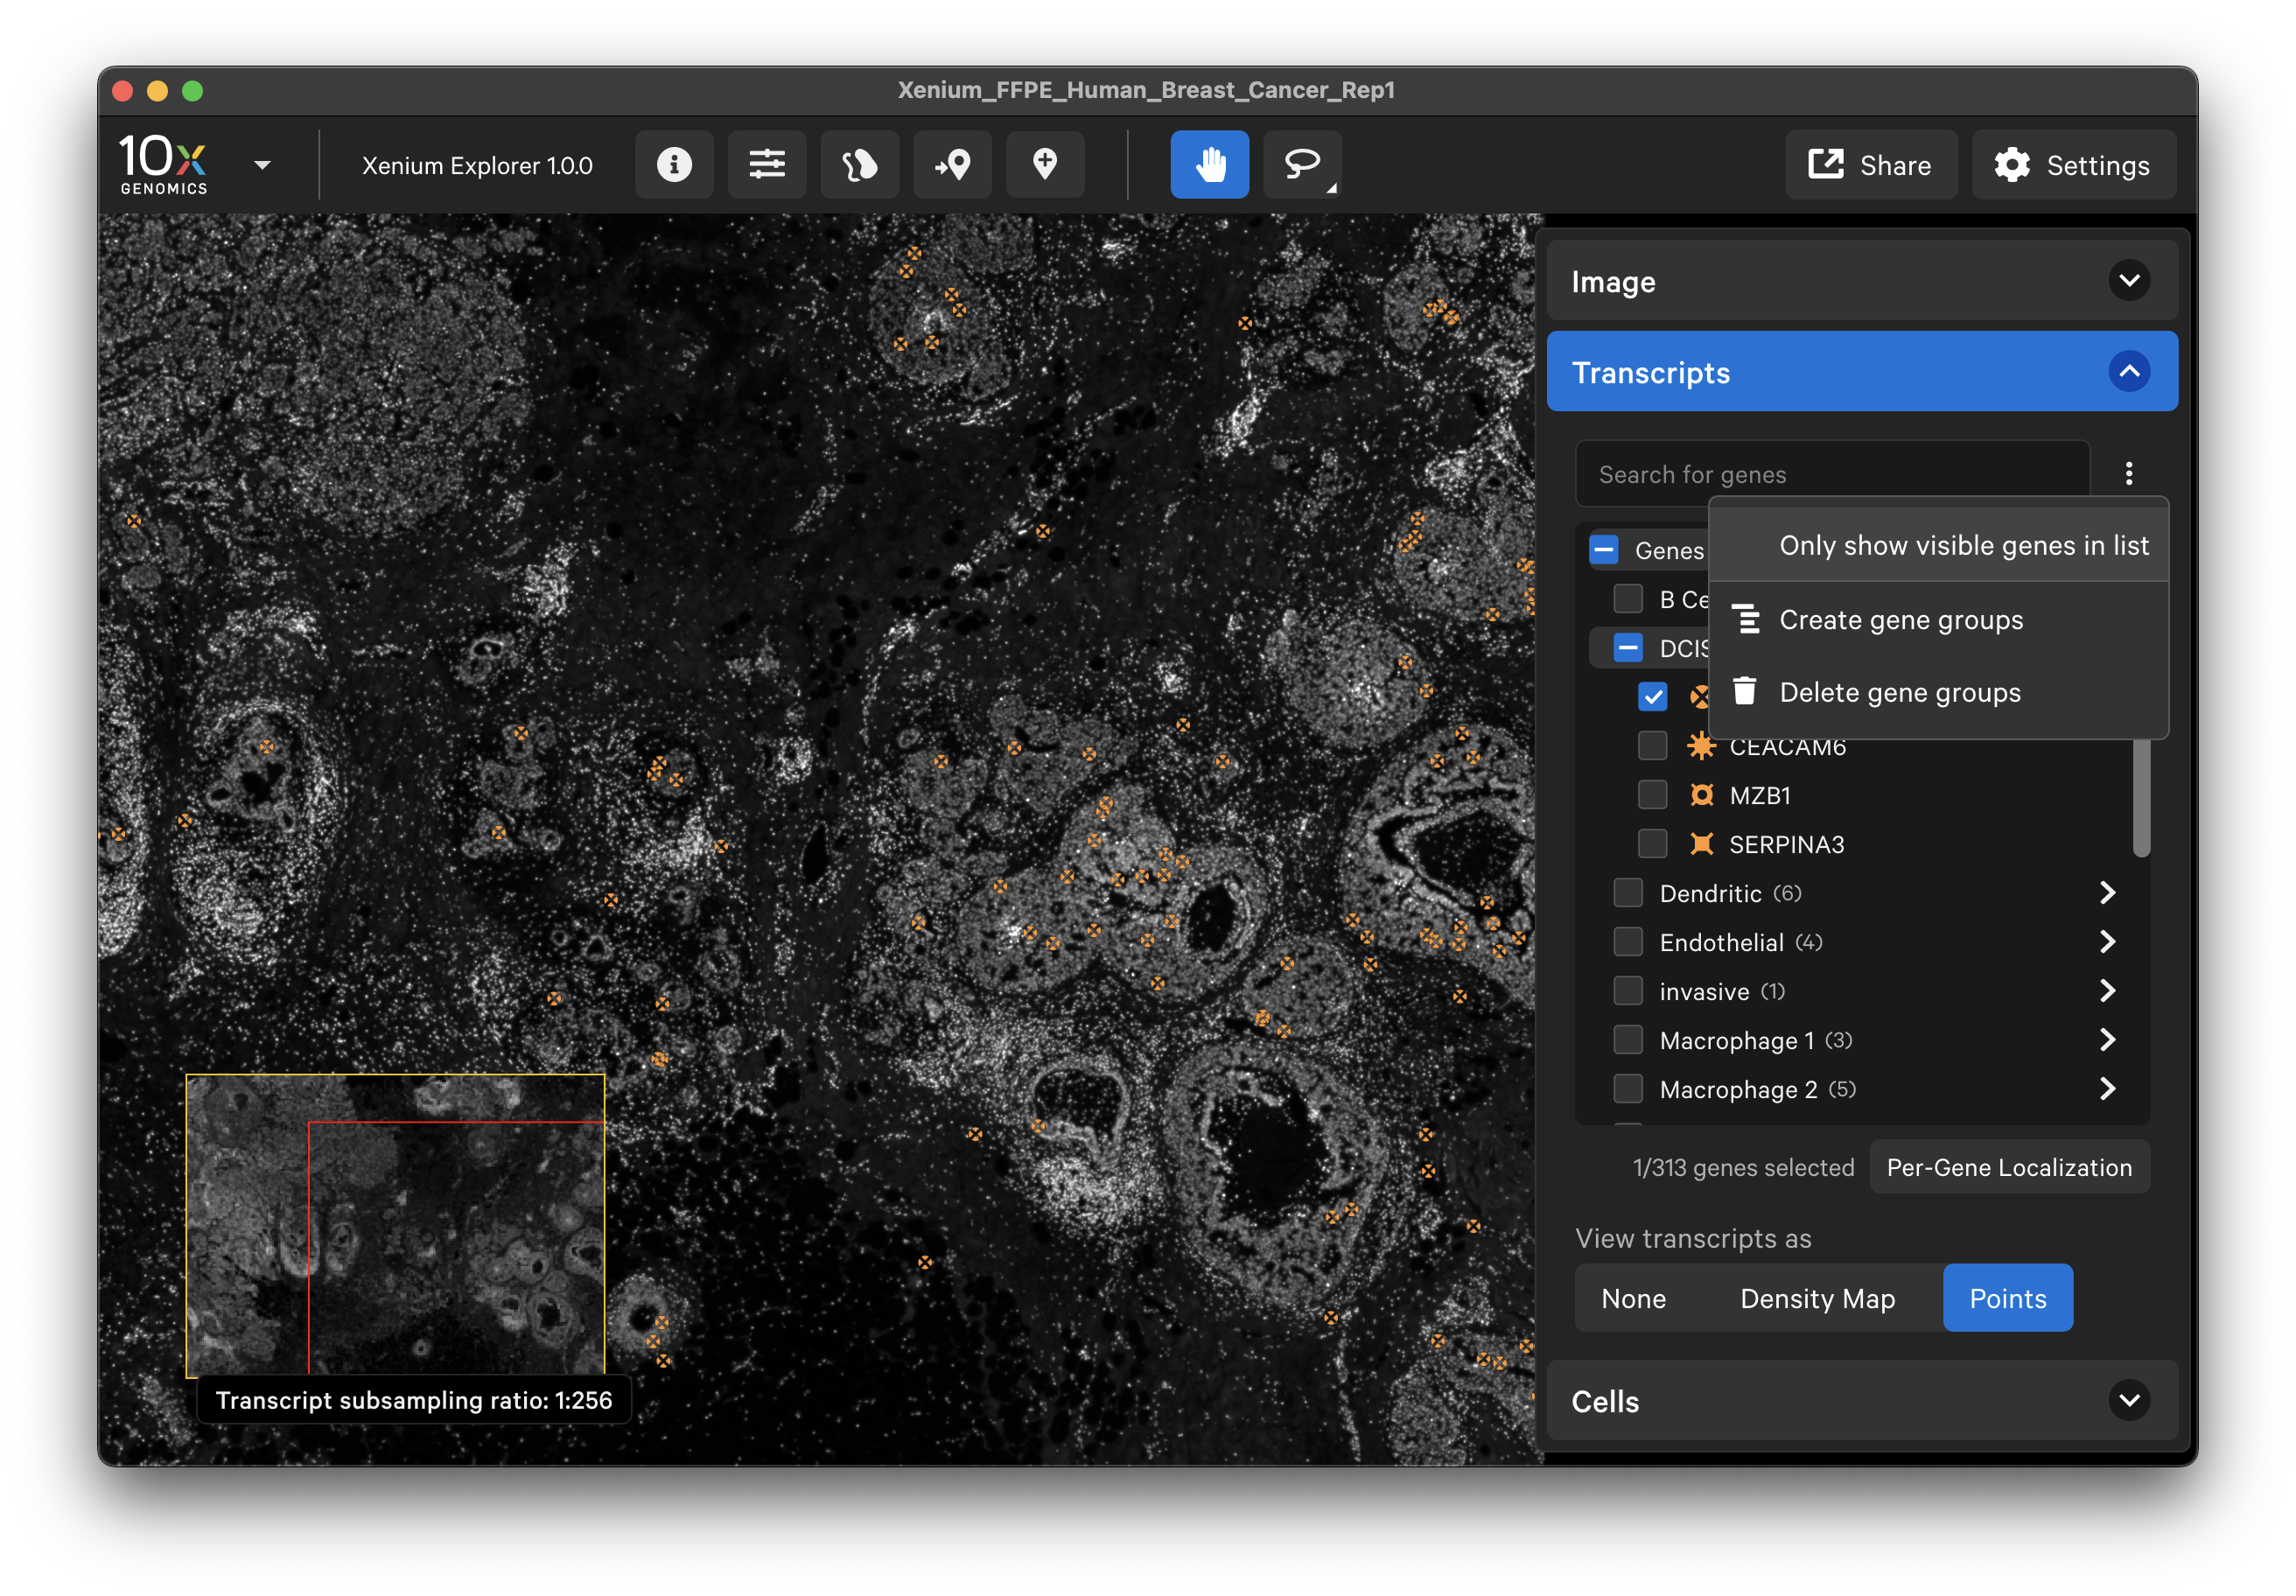
To hide unchecked genes from the gene list area of the Transcripts menu, click the three vertical dots and select Only show visible genes in list. To show all genes in the list again, click the X by Only showing visible genes.
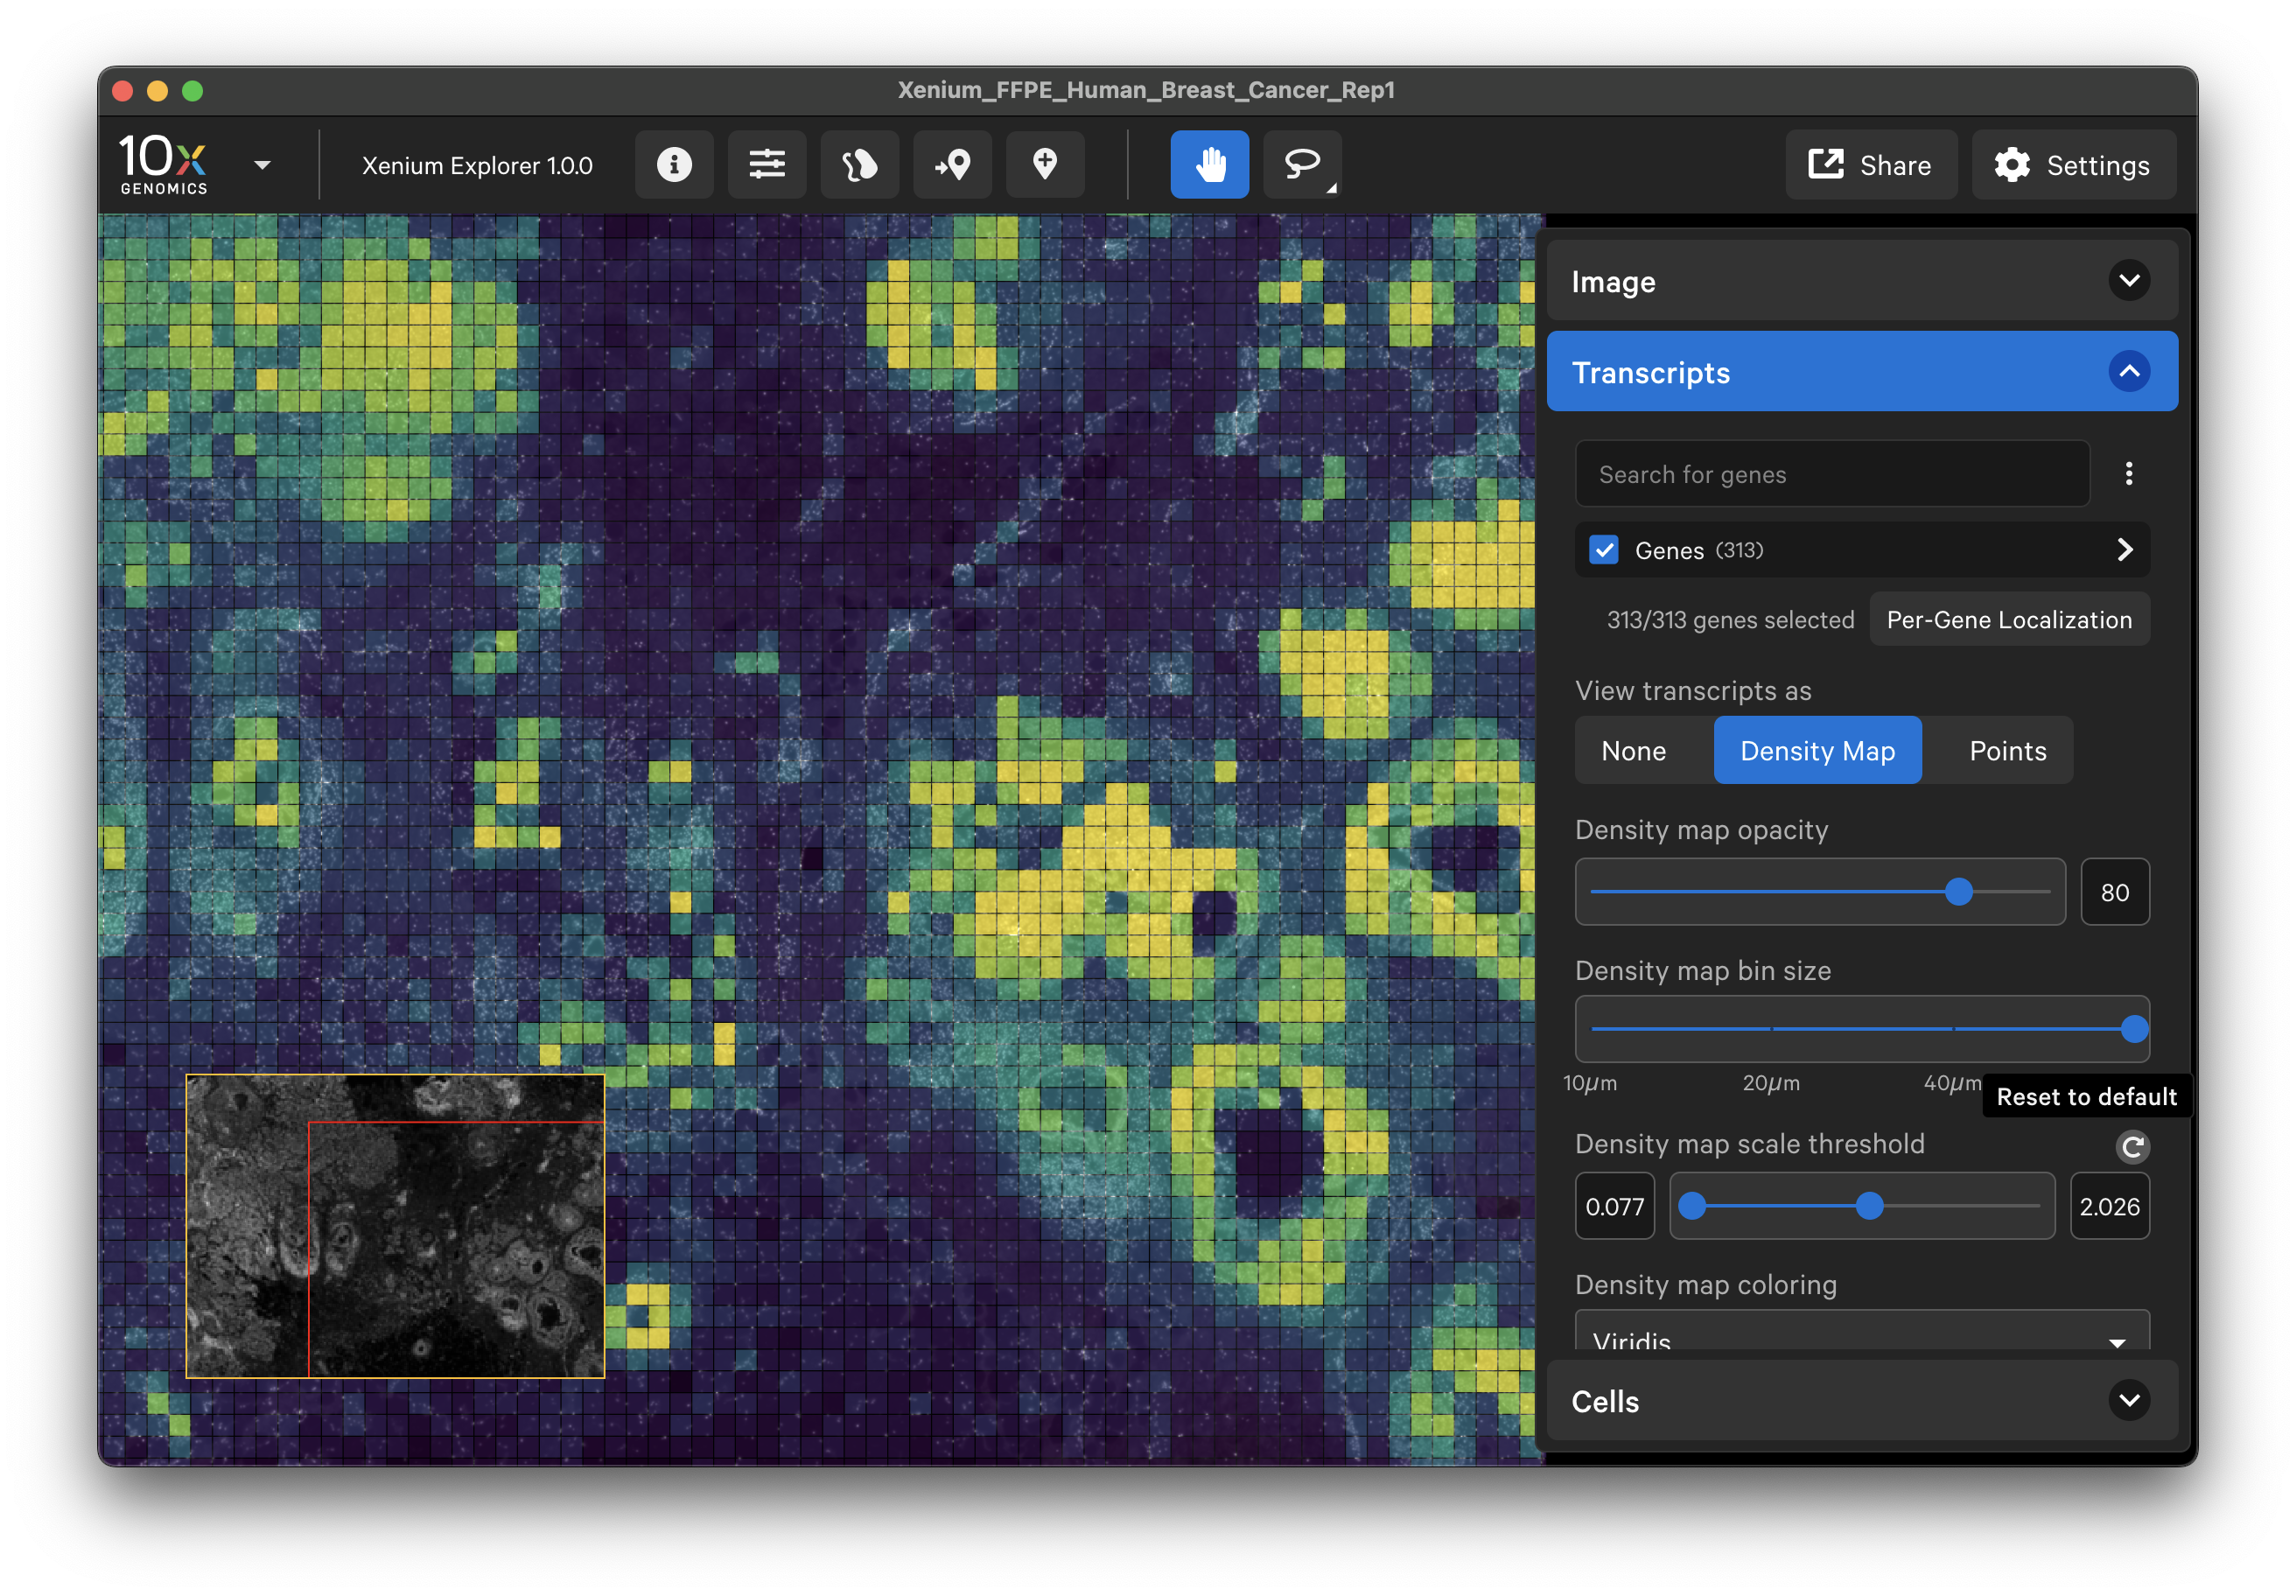
When displayed as a density map, the cumulative density of all checked genes will be visible in the viewing area. The density map opacity, bin size, and scale threshold can be adjusted with the sliders (click arrow above maximum threshold value to reset). There are several density map palette options as well.
When colored by the density map, the lowest transcript density bin maps to the lower end of the palette (i.e., viridis=purple), while the highest transcript density bin maps to the upper end of the palette (i.e., viridis=yellow), with a linear distribution in between. The Density map scale threshold slider allows you to choose a different mapping range, which can help to visualize bins that are at or beyond the limits of the density range.
Transcript point downsampling
When viewing transcripts as points, the transcript points are downsampled when zoomed out. The transcript subsampling ratio is displayed in the lower left-hand corner. You will see more transcript points as you zoom in.
For example, the fully zoomed out image has a 1:1024 transcript subsampling ratio: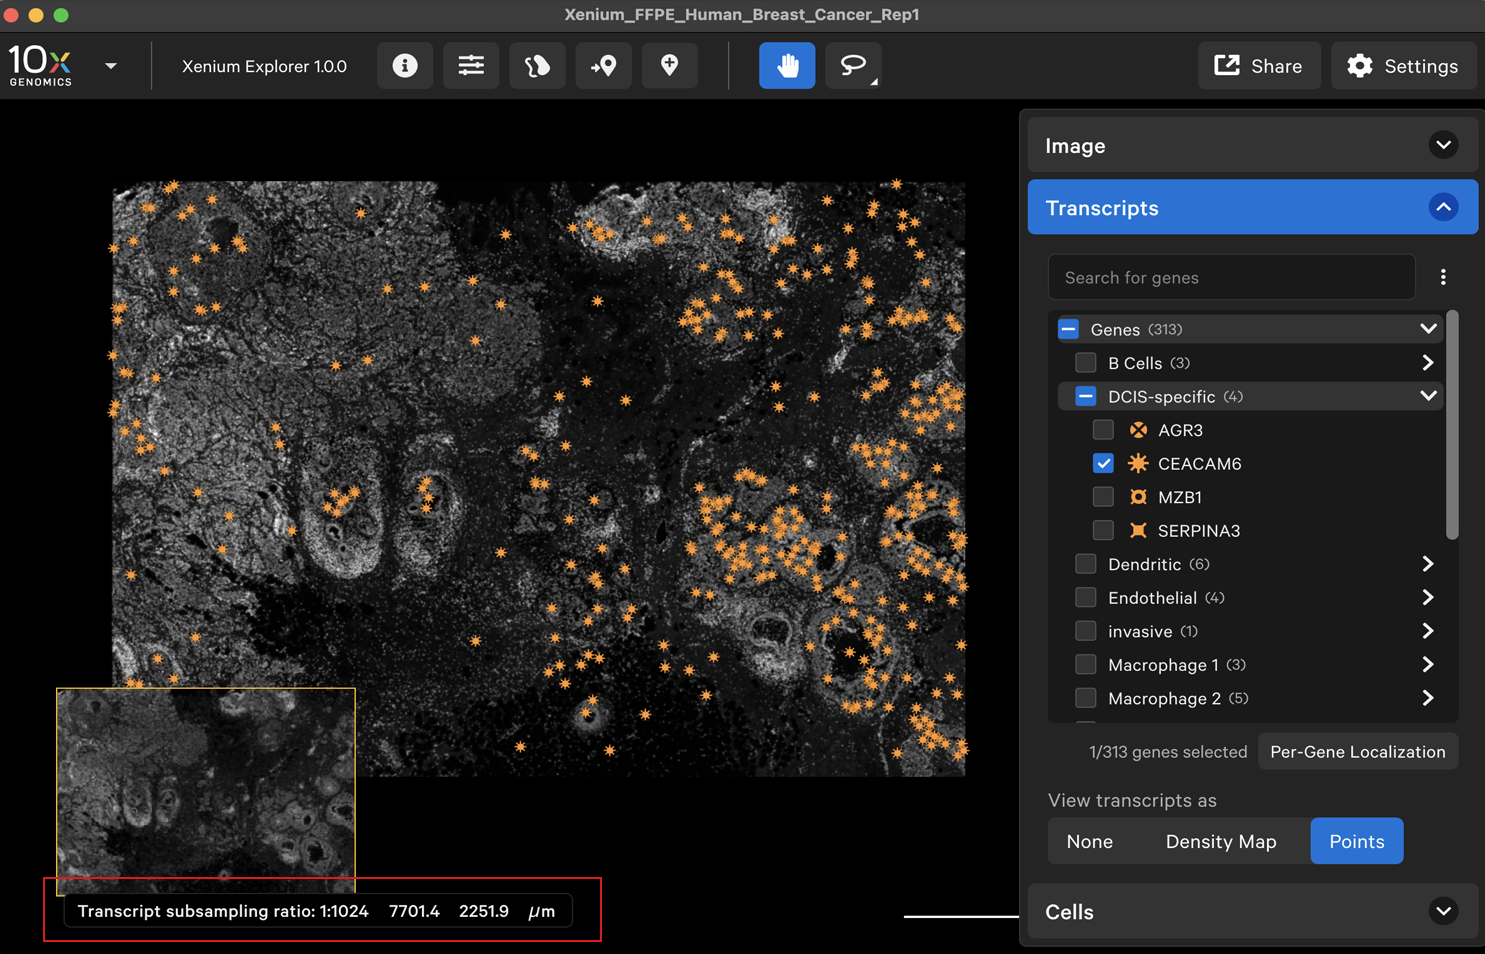
After zooming in, here is a 1:16 transcript subsampling ratio: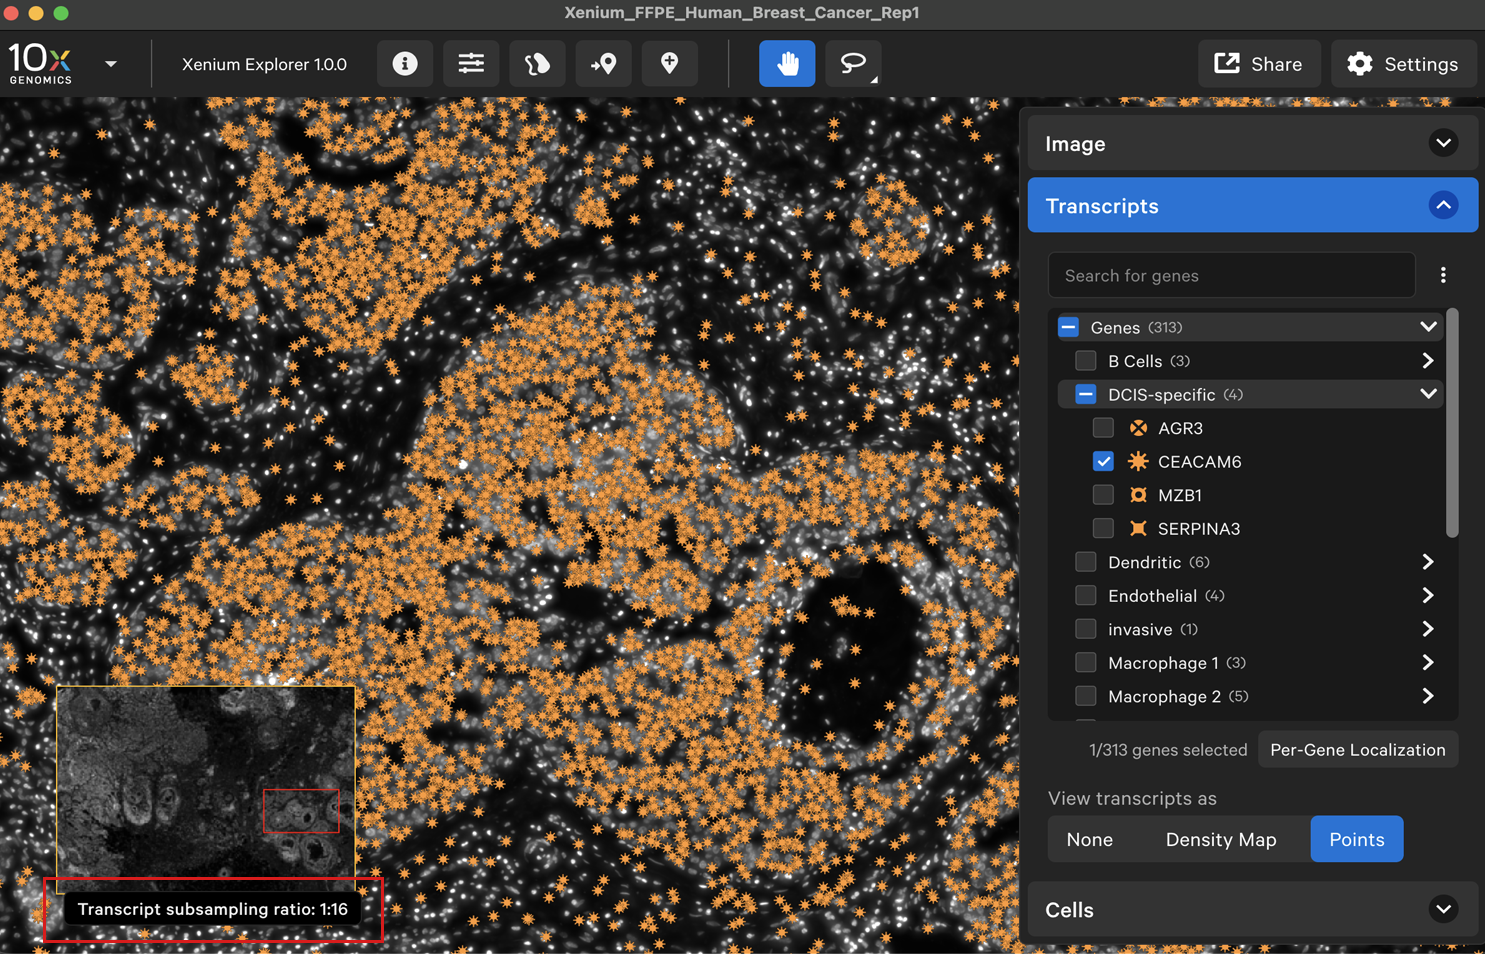
Per-gene localization
The per-gene localization feature is useful for assessing the spatial location of genes in the entire sample area. It displays spatial density map plots of total transcript counts (Q-score ≥ 20) per gene and for all selected genes (combined counts if more than one gene is selected).
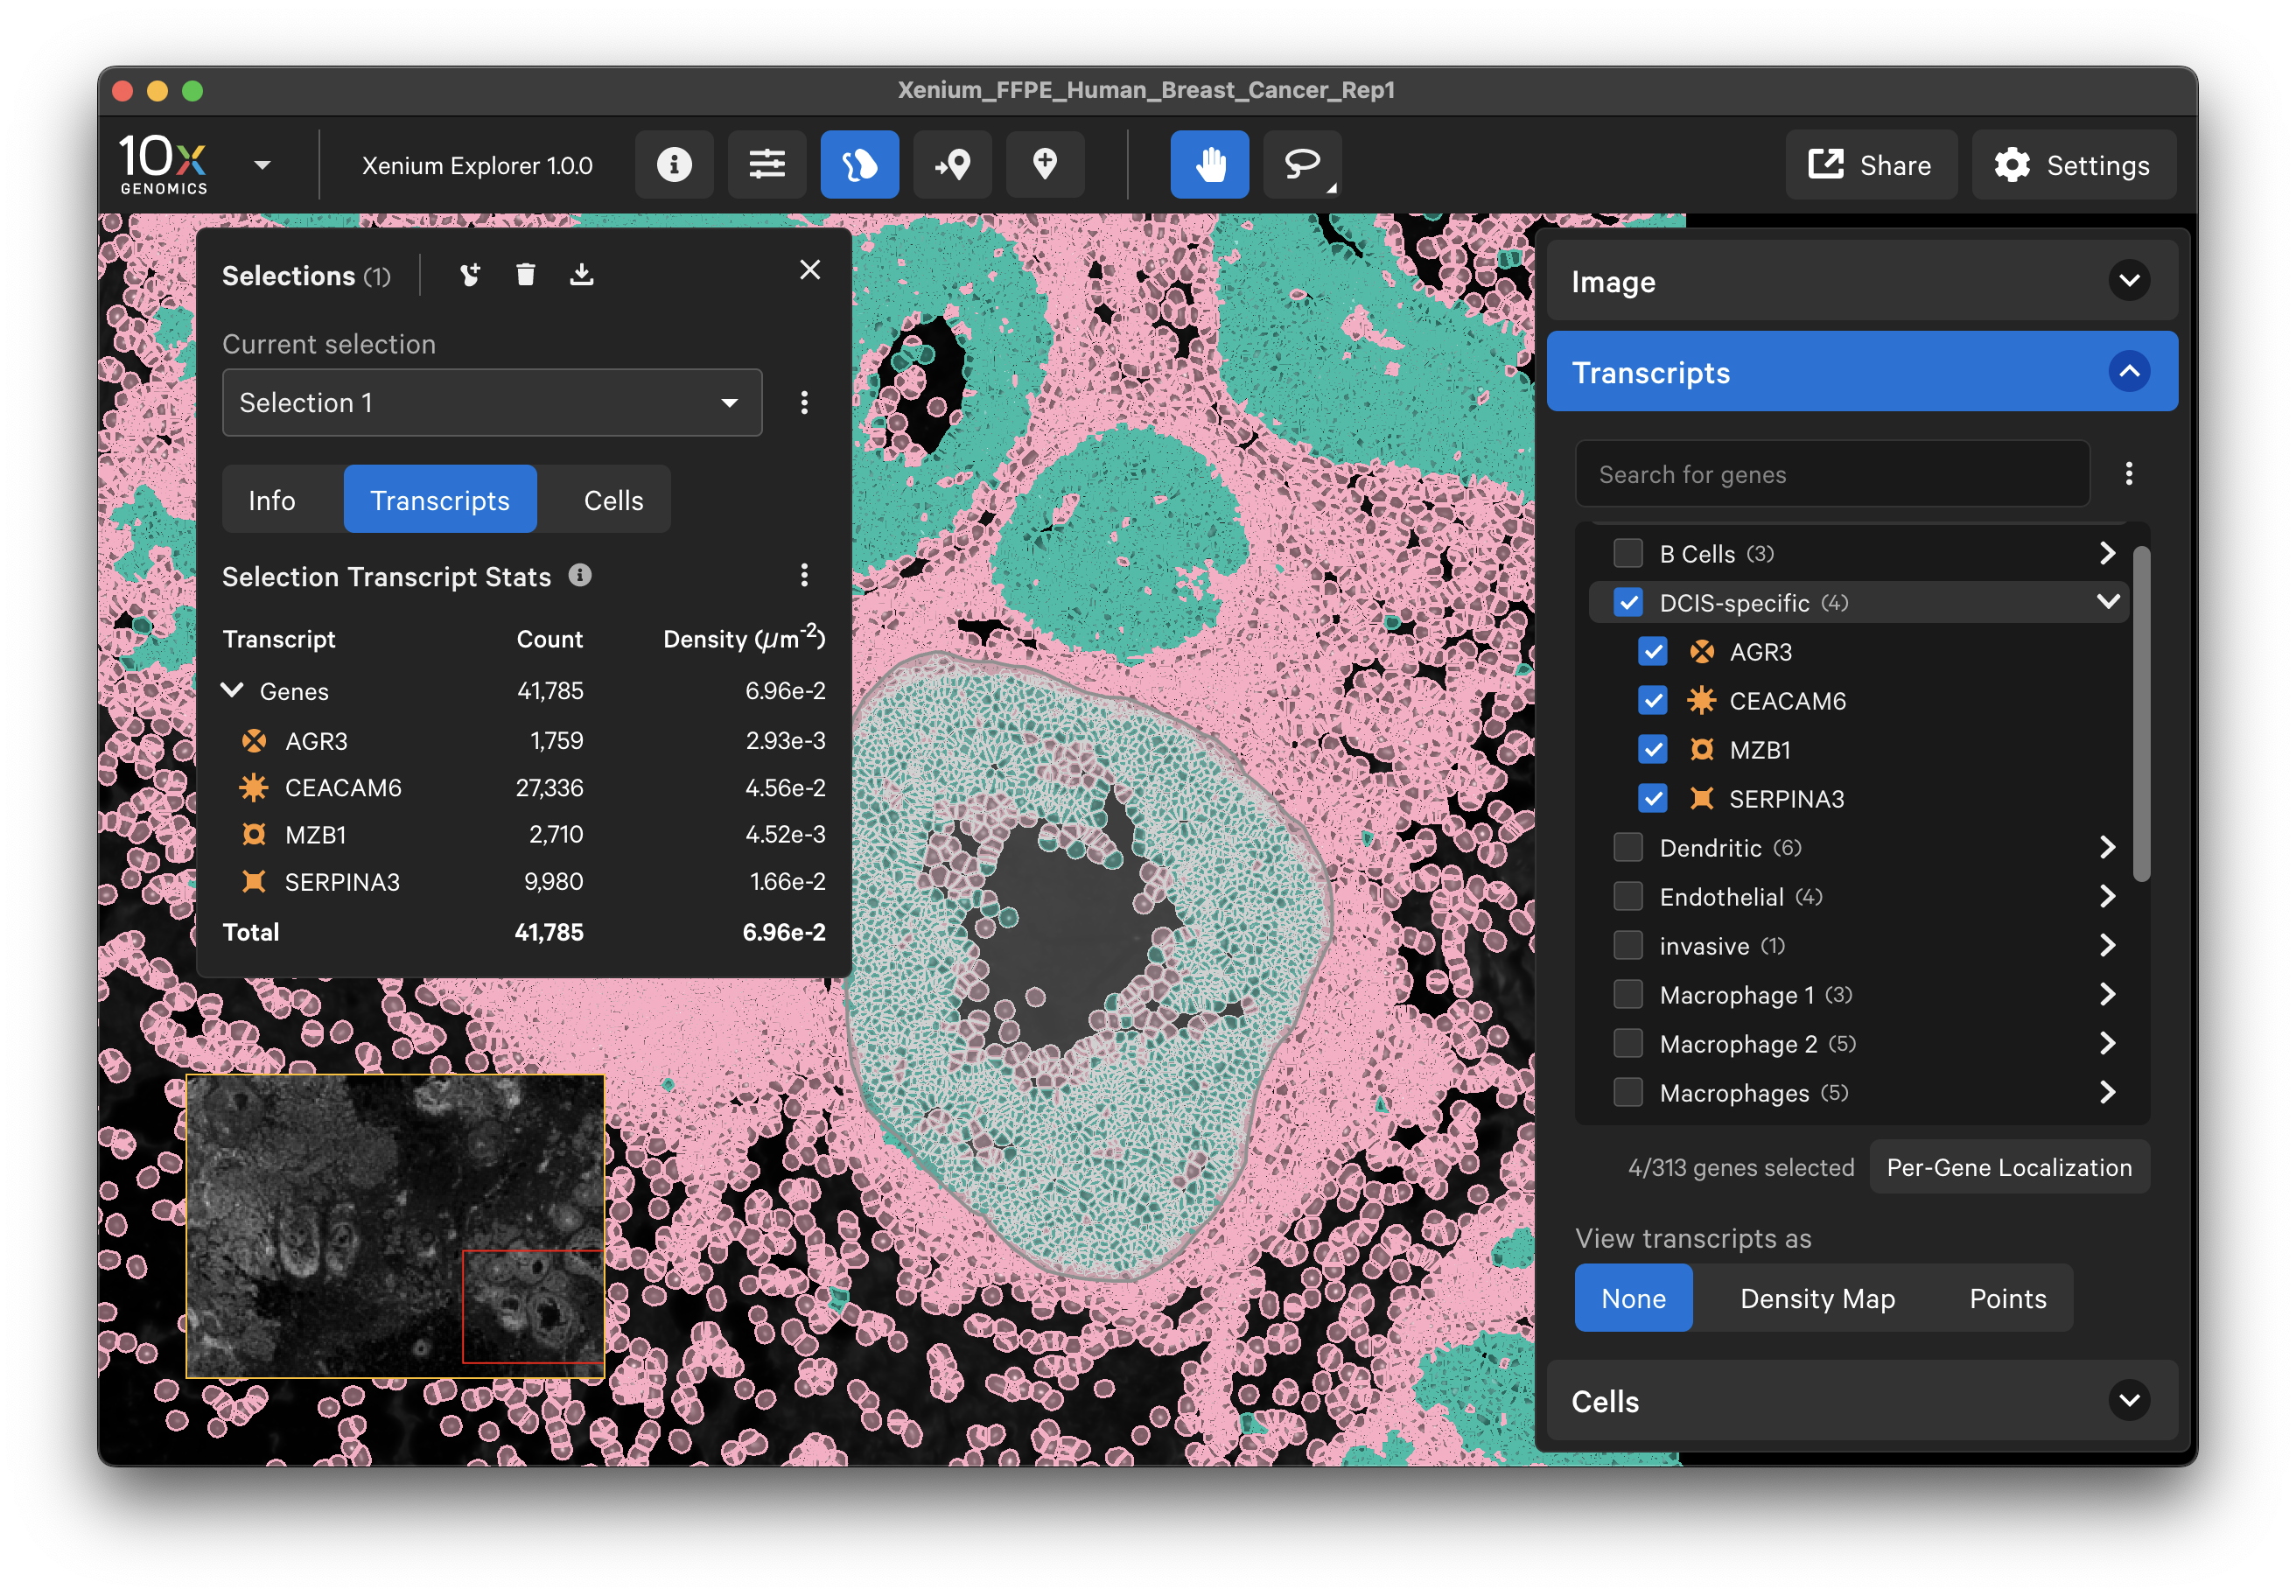
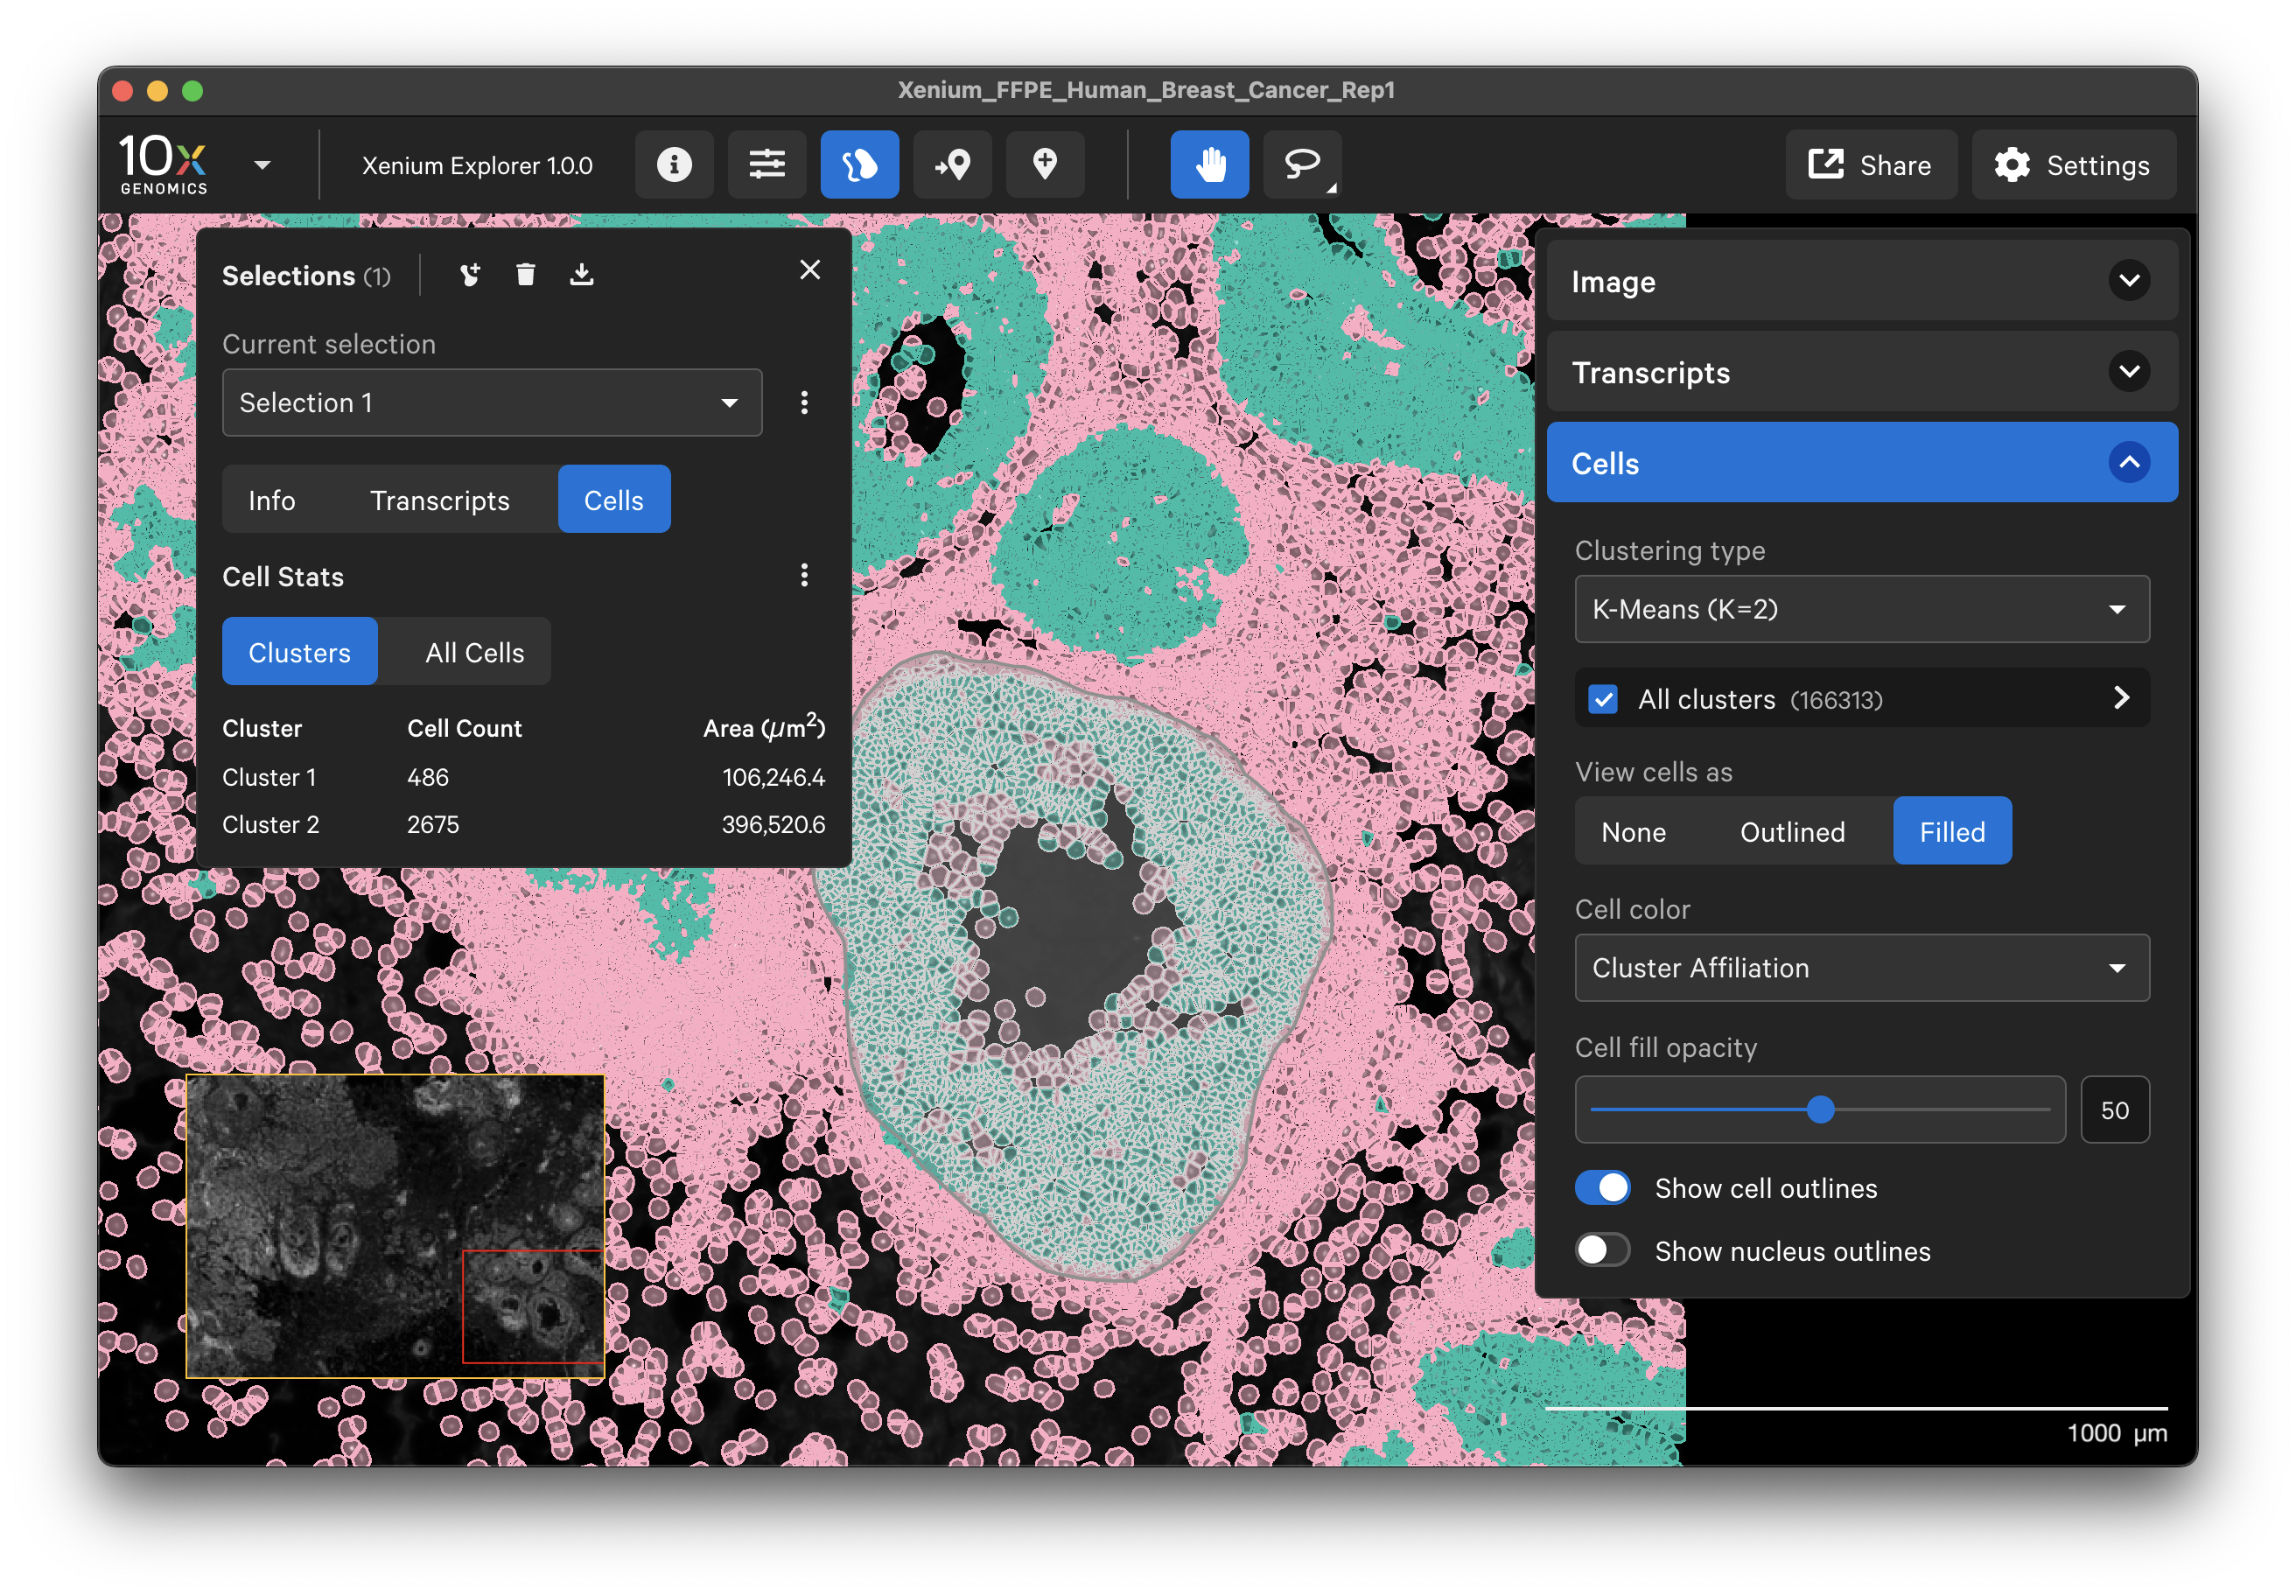
There are two lasso shape options - rectangle and freehand lasso. Both are useful for selecting Regions of Interest (ROIs). For example, the freehand lasso tool is useful for counting genes per cell in specific tissue structures. Learn how to make multiple selections and export information in the Multiple Selections tutorial.
Choose the shape (keyboard shortcuts: L or R) and then use your mouse to draw the shape (release mouse to complete selection shape). If genes are checked in the Transcripts menu, the selection box displays transcript and cell information for the selected area (transcripts do not need to be displayed to appear in the selection box). The selection box displays the cell clusters that are checked in the Cells menu when either Cluster Affiliation or White is selected for cell color (cells may be viewed as none, outlined, or filled).
Note: Transcript counts are not shown for very large selections for optimal performance. If your selection reaches the limit, you will see the message "Decrease the selection size to see transcript counts."
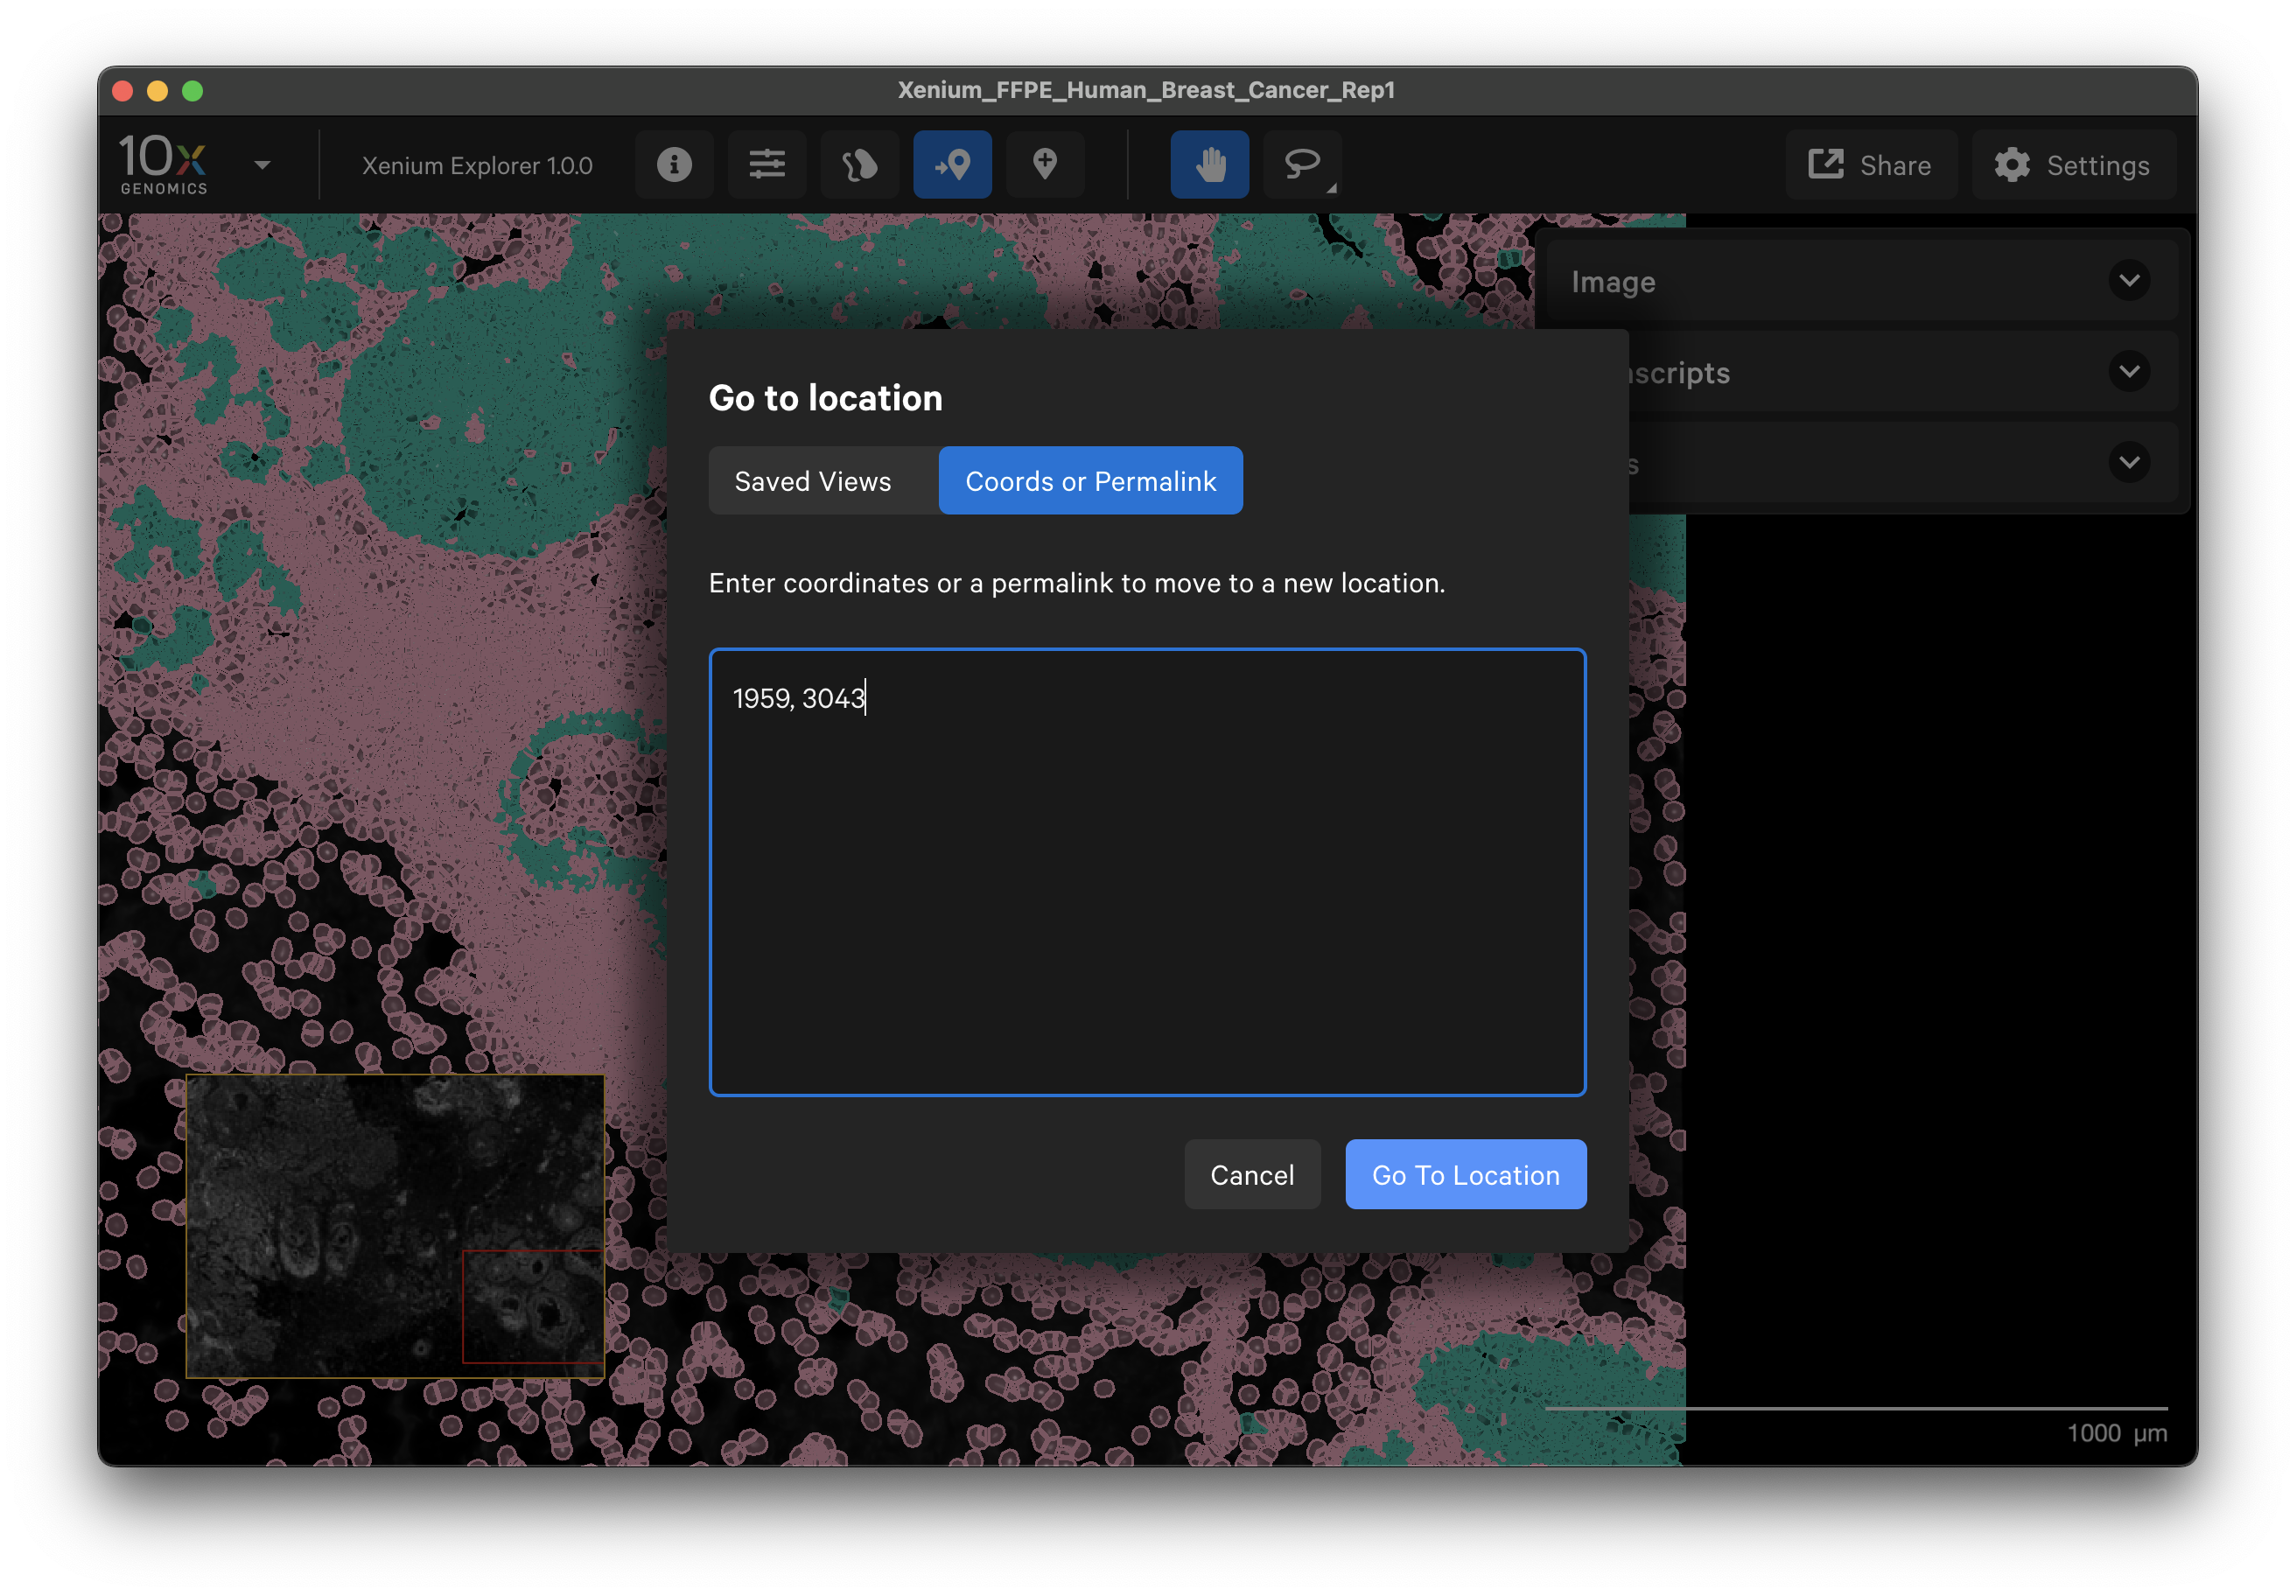
The Go to location button enables you to jump to a specific X-Y coordinate location in the image, open a saved view, or transfer a permalink view from another session. X-Y coordinate values are shown in the lower left-hand corner of the viewing area. The X-Y format must be comma-separated (i.e., 1959, 3043). Lists of coordinates from selected Regions of Interest or cells should be pasted with the Lasso button’s Paste coordinates feature (see Multiple Selections tutorial).
Editing the manifest file to visualize custom analyses
The experiment.xenium manifest file contains metadata read in by Xenium Explorer about the experiment, including the paths to the input files listed above. The file names in the images and xenium_explorer_files sections use the default output file names from Xenium Onboard Analysis.
In order to view and interact with custom analysis results in Xenium Explorer, you can edit these sections of the manifest file. Because the experiment.xenium file is a text file in JSON format, changes can be made in any text editor. The file paths can be absolute or relative. However, relative paths should not use a tilda (~) for home directory path expansion.
Example 1: Viewing H&E images
The Xenium workflow is non-destructive, enabling researchers to derive additional information, including H&E, from the identical tissue section. In a future software release, 10x Genomics will provide a supported workflow to align H&E images directly with Xenium data. To facilitate custom analyses, H&E images that are registered with third-party software can be viewed in Xenium Explorer with a few modifications to file paths in the manifest file.
-
Download the post-Xenium H&E image and Xenium Output Bundle zip files. Registered H&E images are available for these 10x public datasets:
-
Unzip the bundle zip file.
-
Edit the
experiment.manifestfile:- Copy the original image paths to a new object (e.g.,
original_images) so you do not lose the file name and path syntax - In
images: enter the H&E image file name into themorphology_filepathfield - In
images: delete themorphology_mip_filepathandmorphology_focus_filepathfields
- Copy the original image paths to a new object (e.g.,
For example, for tissue sample 1 from the FFPE Human Breast with Pre-designed Panel dataset, make the following edits:
[...]
"original_images": {
"morphology_filepath": "morphology.ome.tif",
"morphology_mip_filepath": "morphology_mip.ome.tif",
"morphology_focus_filepath": "morphology_focus.ome.tif"
},
"images": {
"morphology_filepath": "Xenium_V1_FFPE_Human_Breast_IDC_he_image.ome.tif"
},
[...]
- Double-click the
experiment.manifestfile to open it in Xenium Explorer. You should now be able to see the H&E image with the usual cell and transcript visualization options.
The DAPI and H&E images cannot be viewed in the same Xenium Explorer window at this time (this feature will be implemented in a future software release). However, you can make a copy of the manifest file (e.g., experiment_dapi.xenium) and set the images paths to the DAPI morphology images:
[...]
"images": {
"morphology_filepath": "morphology.ome.tif",
"morphology_mip_filepath": "morphology_mip.ome.tif",
"morphology_focus_filepath": "morphology_focus.ome.tif"
},
[...]
Then open the copy in a second Xenium Explorer window to see DAPI and H&E side-by-side. Use the Share options to view the same part of the image in each window.
Here are some example cell outline and transcript density views with DAPI vs. H&E images in Xenium Explorer: 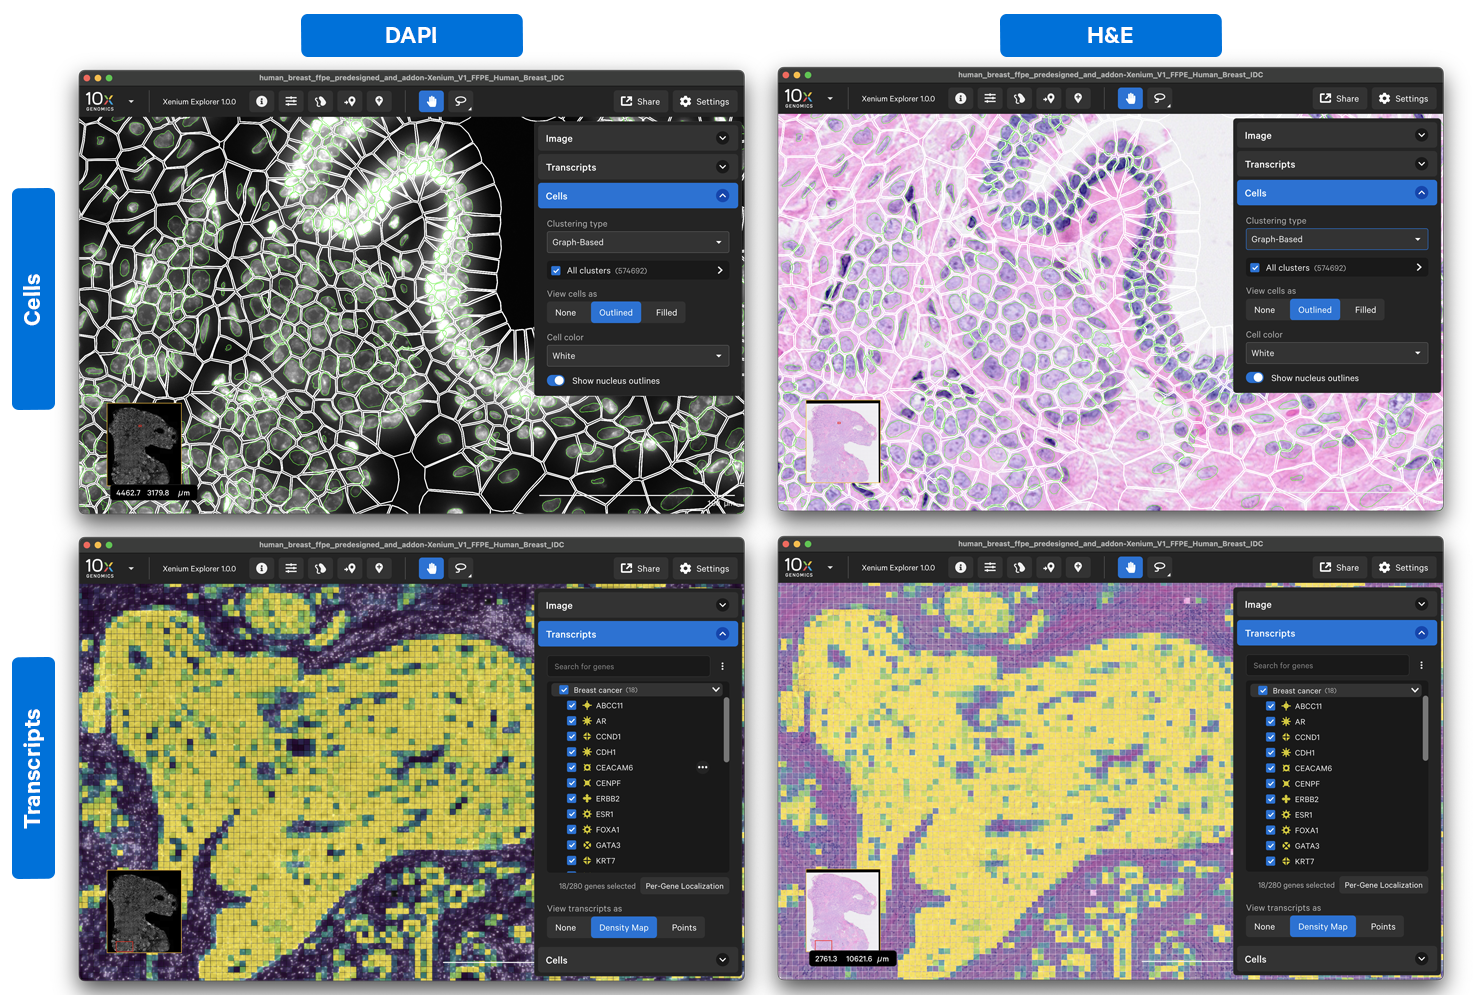
Example 2: Custom secondary analysis
If you created a custom secondary analysis file, you can replace analysis.zarr.zip with a custom file path (e.g., custom_analysis/my_analysis.zarr.zip) in the “analysis_zarr_filepath” line (4th line of xenium_explorer_files section):
[...]
"xenium_explorer_files": {
"transcripts_zarr_filepath": "transcripts.zarr.zip",
"cells_zarr_filepath": "cells.zarr.zip",
"cell_features_zarr_filepath": "cell_feature_matrix.zarr.zip",
"analysis_zarr_filepath": "custom_analysis/my_analysis.zarr.zip",
"analysis_summary_filepath": "analysis_summary.html"
}
