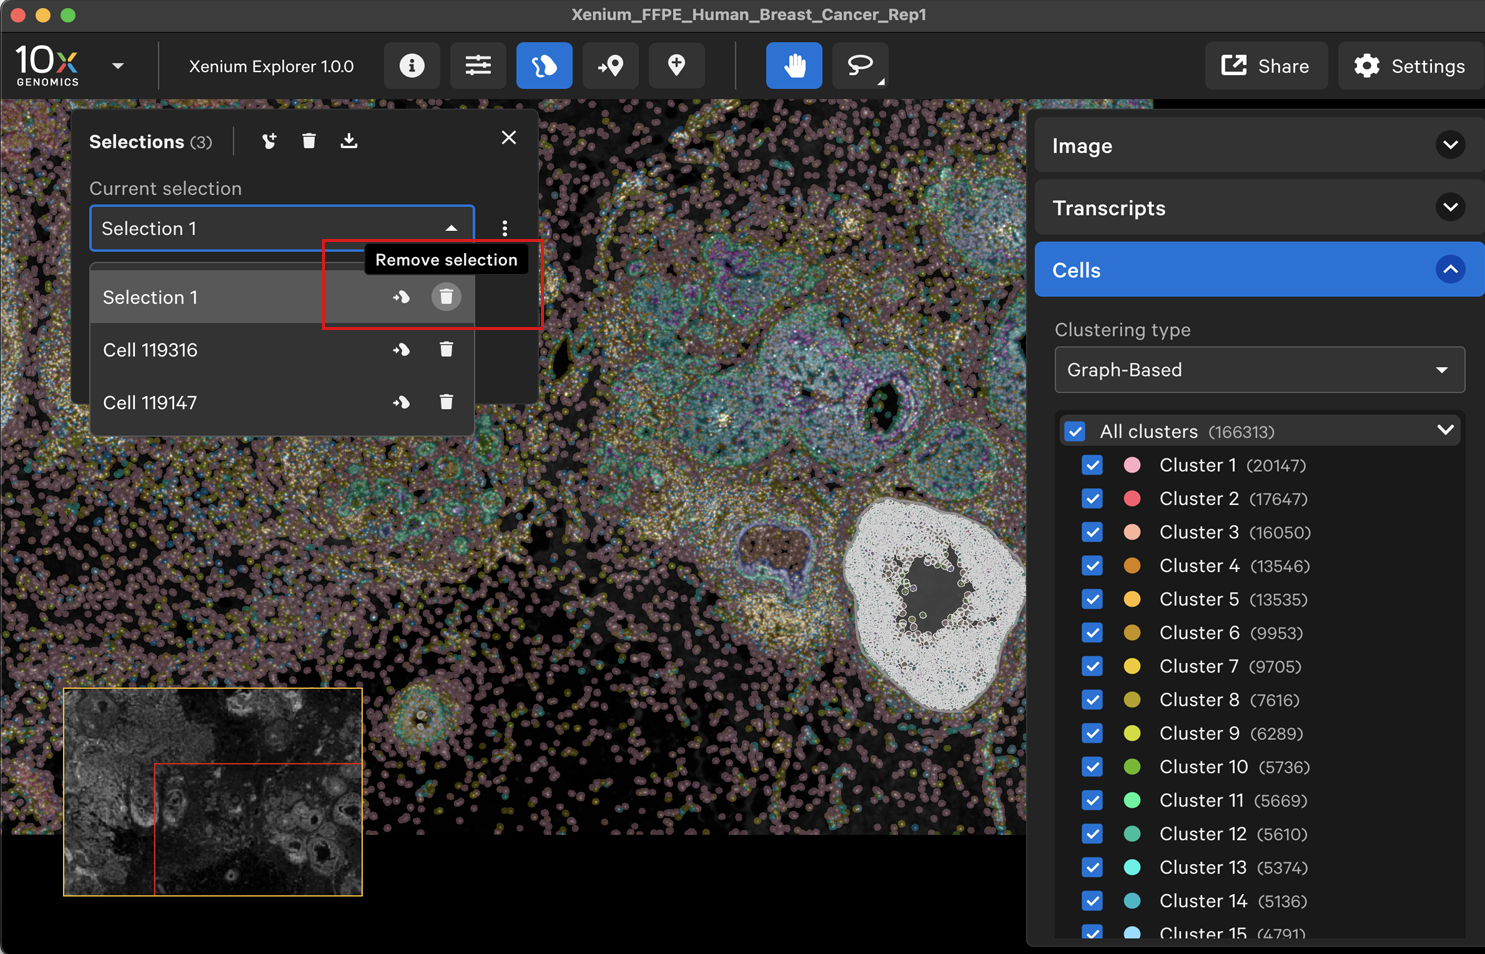
The Selections pop-up window allows you to view and export information about selected regions. Selections lists both selected Regions of Interest (ROIs) and selected cells in the drop-down menu of the pop-up window.
The lasso tool allows you to create multiple ROI selections with both the rectangle and freehand lassos. You can also make overlapping selections.
To select specific cells, make sure tooltips are turned on (Settings > Show Tooltips). View cells (outlined or filled) and click on the cell of interest. It will be added to the list of Selections. If you click on a cell that is completely within an active ROI selection, the selection box will show cell statistics for the cell within the selection instead of adding a new cell ID to the list of Selections. To add the cell as its own cell selection, switch to a different active selection or close the Selections window.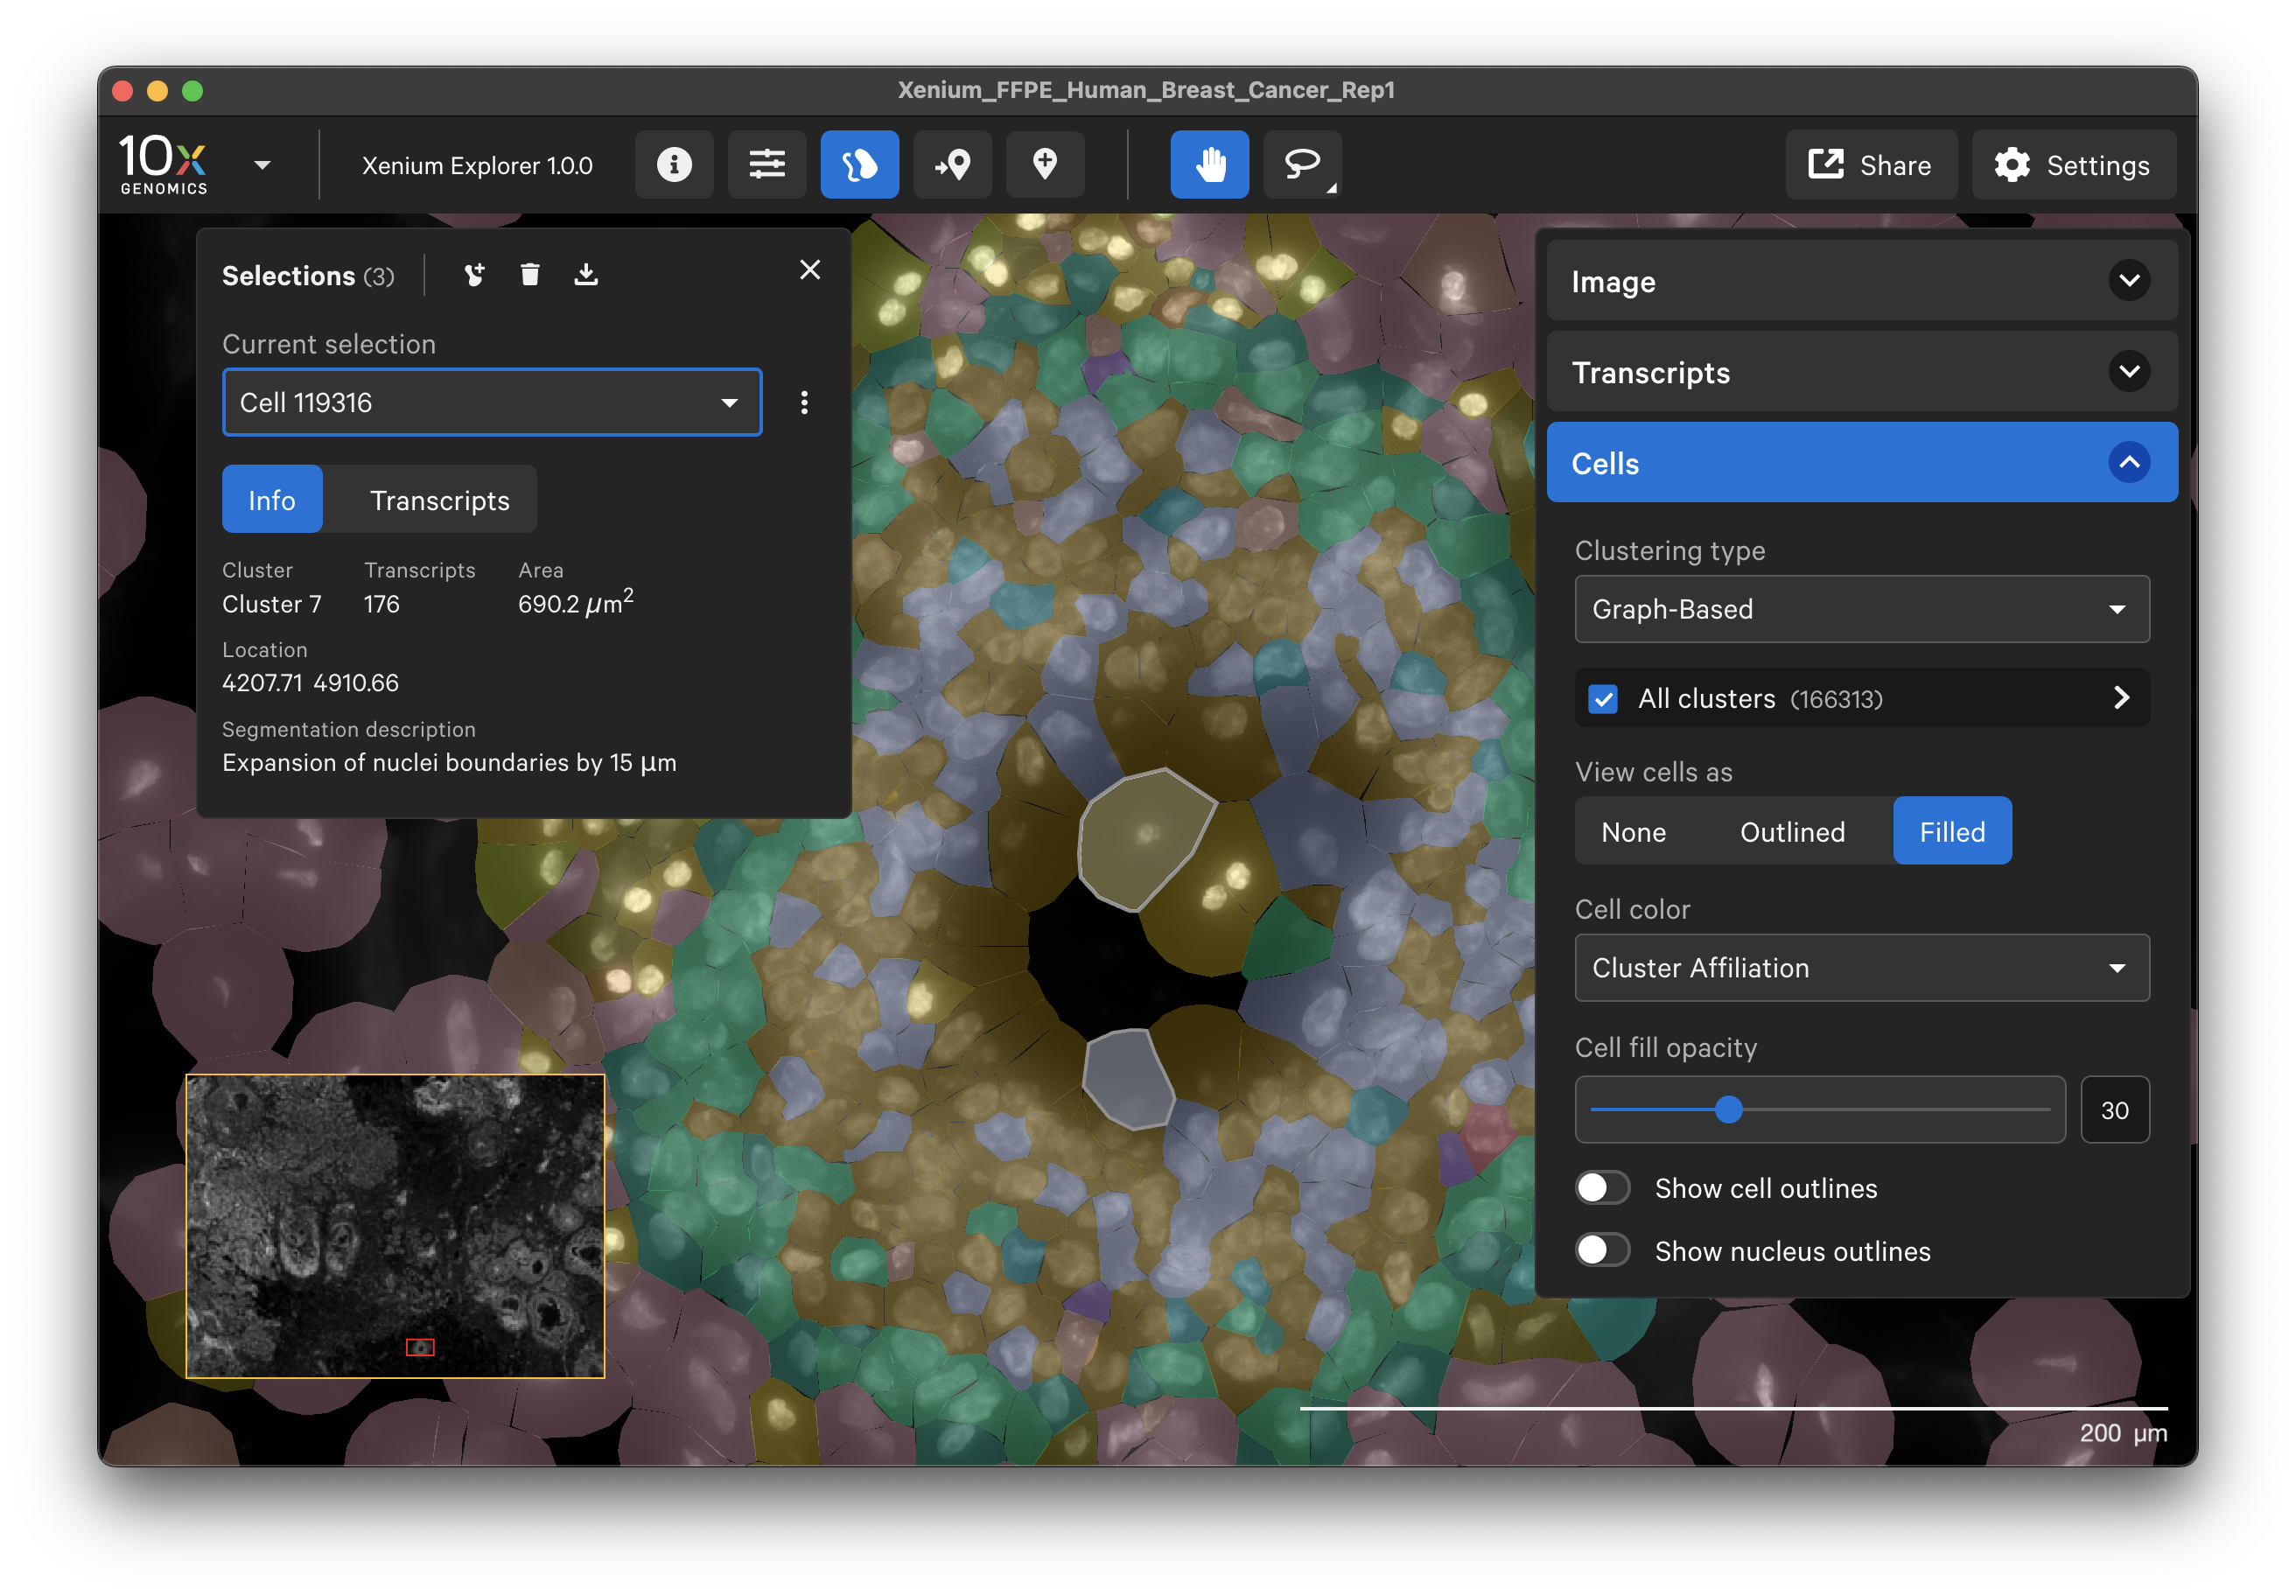
The following information is displayed for each selection.
| Tabs | Selected ROI | Selected cell |
|---|---|---|
| Info | Area, total transcript count*, total cell count | Cluster assignment from clustering type selected in Cells menu, transcript count*, cell area, X-Y location, segmentation description |
| Transcripts | Count and density per transcript in the selection for genes checked in the Transcripts menu | Count and density per transcript in the cell for genes checked in the Transcripts menu |
| Cells | For cells completely contained in the selection: cell count and area per cluster for clustering type selected in Cells menu, cluster assignment, transcript count, cell area per cell, cell ID from the All Cells tab (with links to cell-specific statistics) | (Not applicable) |
*Transcript counts in selected ROIs are derived from transcript assignments by cell segmentation polygon boundaries, which are used in Xenium Explorer as approximations for visualization performance. Transcript counts in selected cells are derived from transcript assignments by cell segmentation masks in the cell-feature matrix.
Selected ROIs and cells are automatically labeled, but both can be renamed.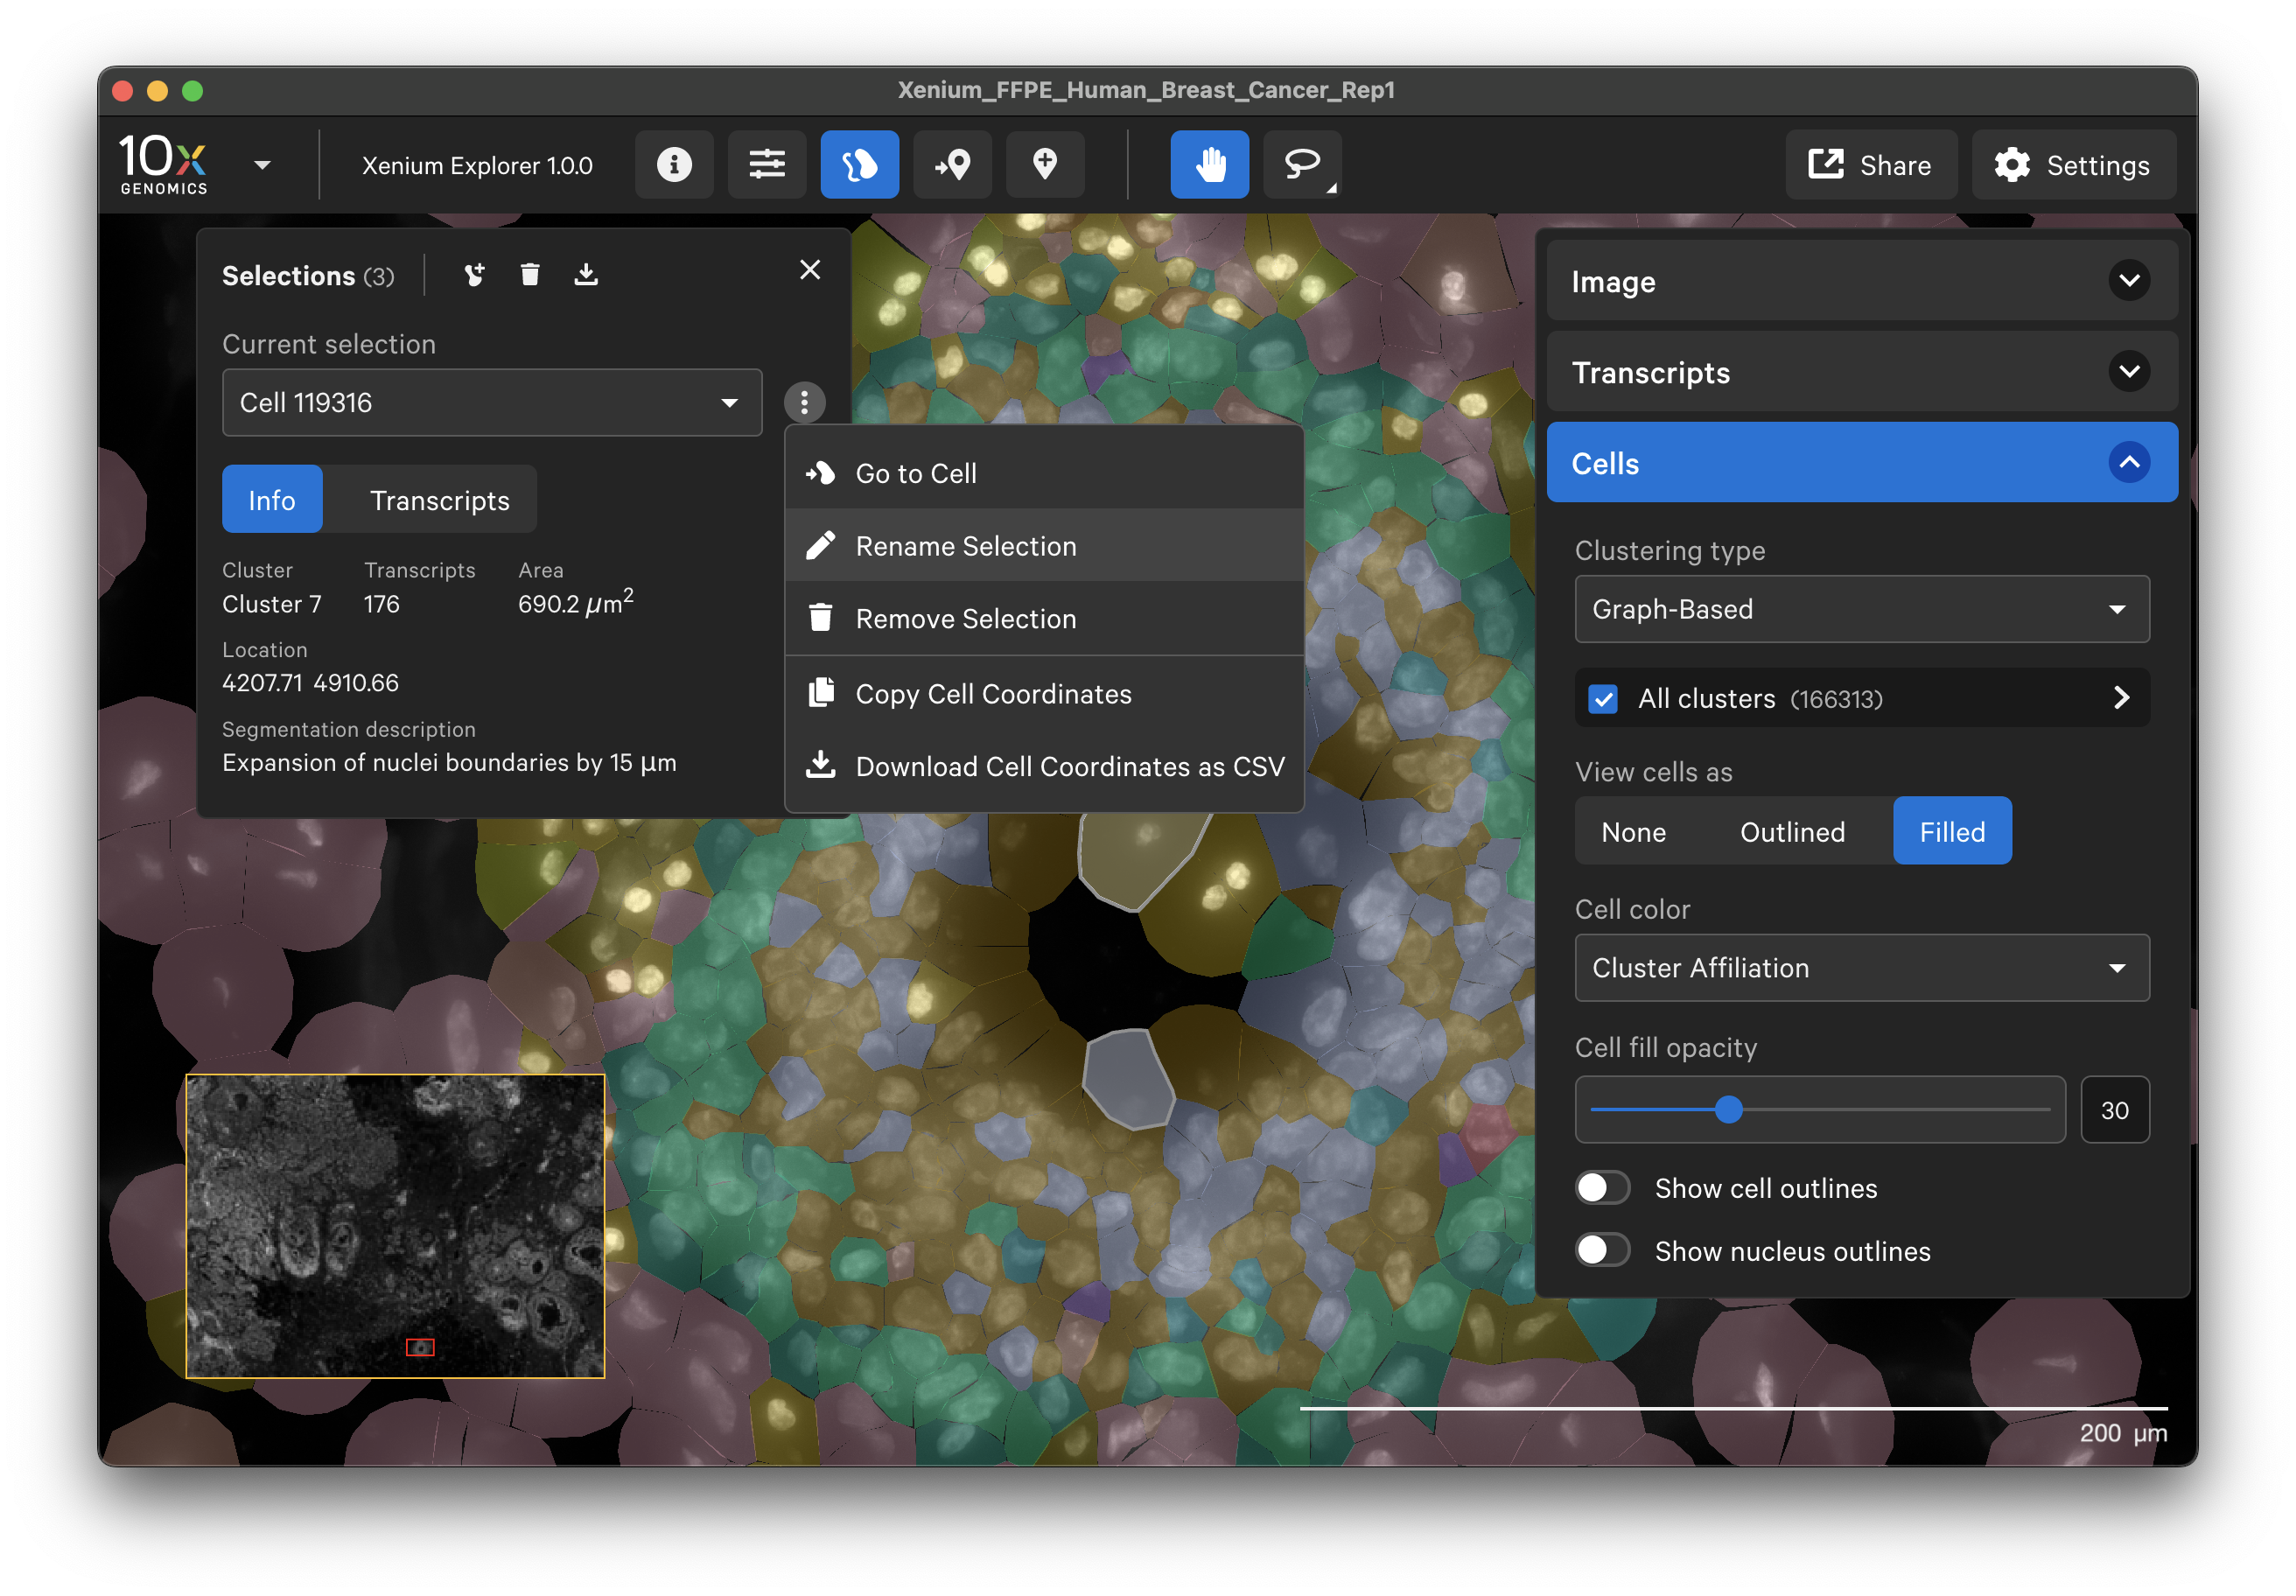
Add another selection
Use the Add another selection icon on the Selections pop-up window to draw a new selection. 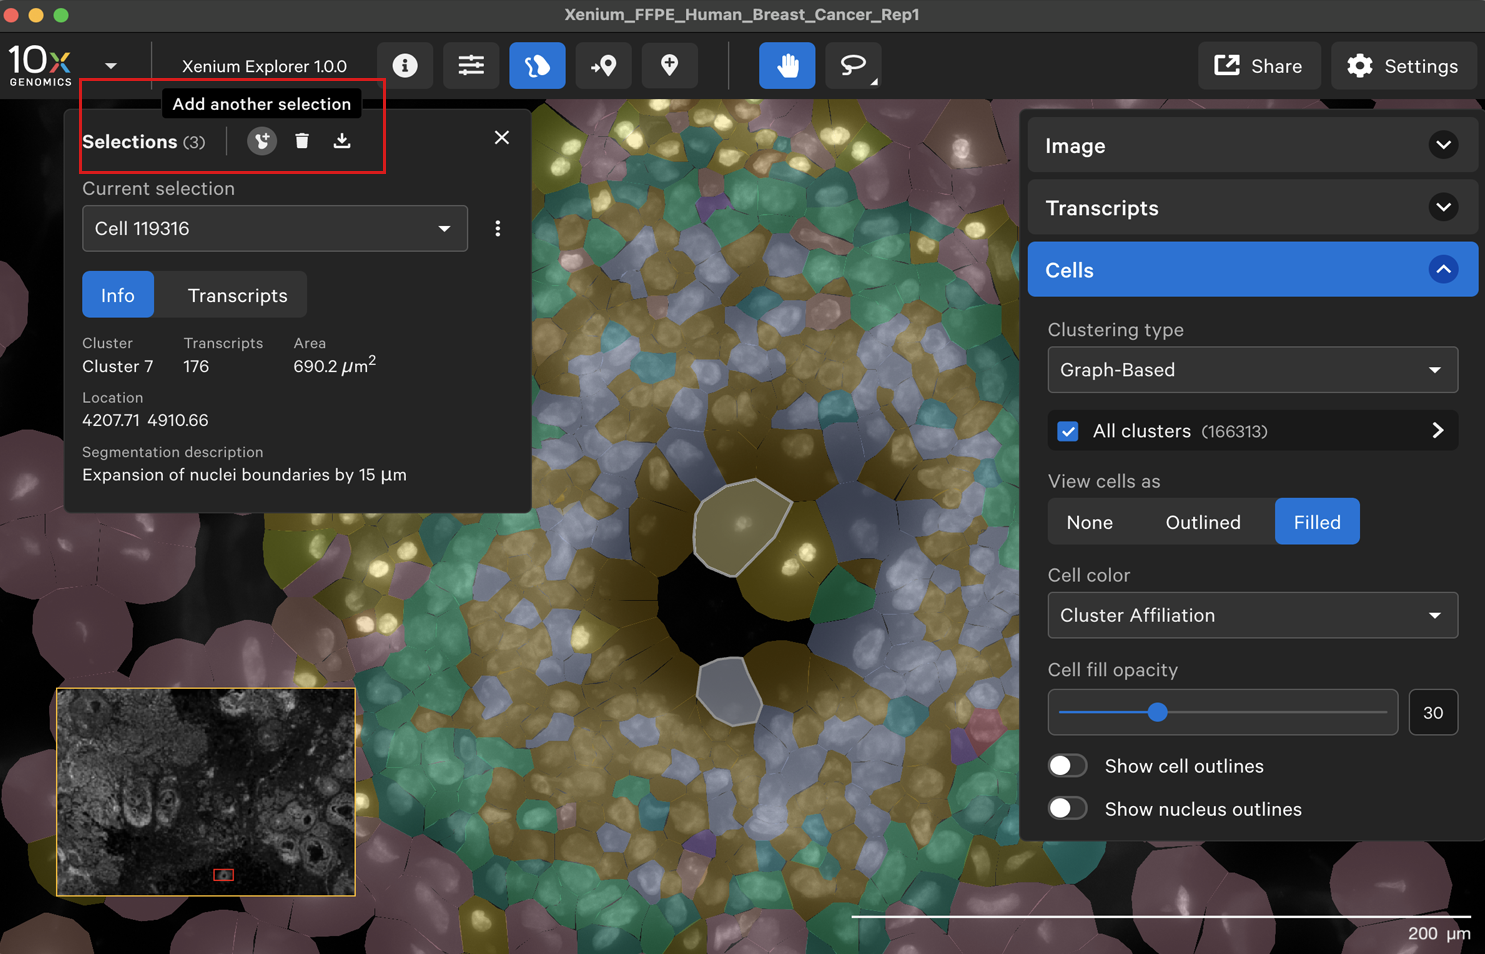
You can also click on the lasso tool to draw a new selection and it will be added to the Selections pop-up window
Selected ROIs and cells are collected into the same Selections window. The drop-down menu allows you to switch between selected ROIs and cells. The Go to selection icon allows you to jump to a specific selection in the viewing area.
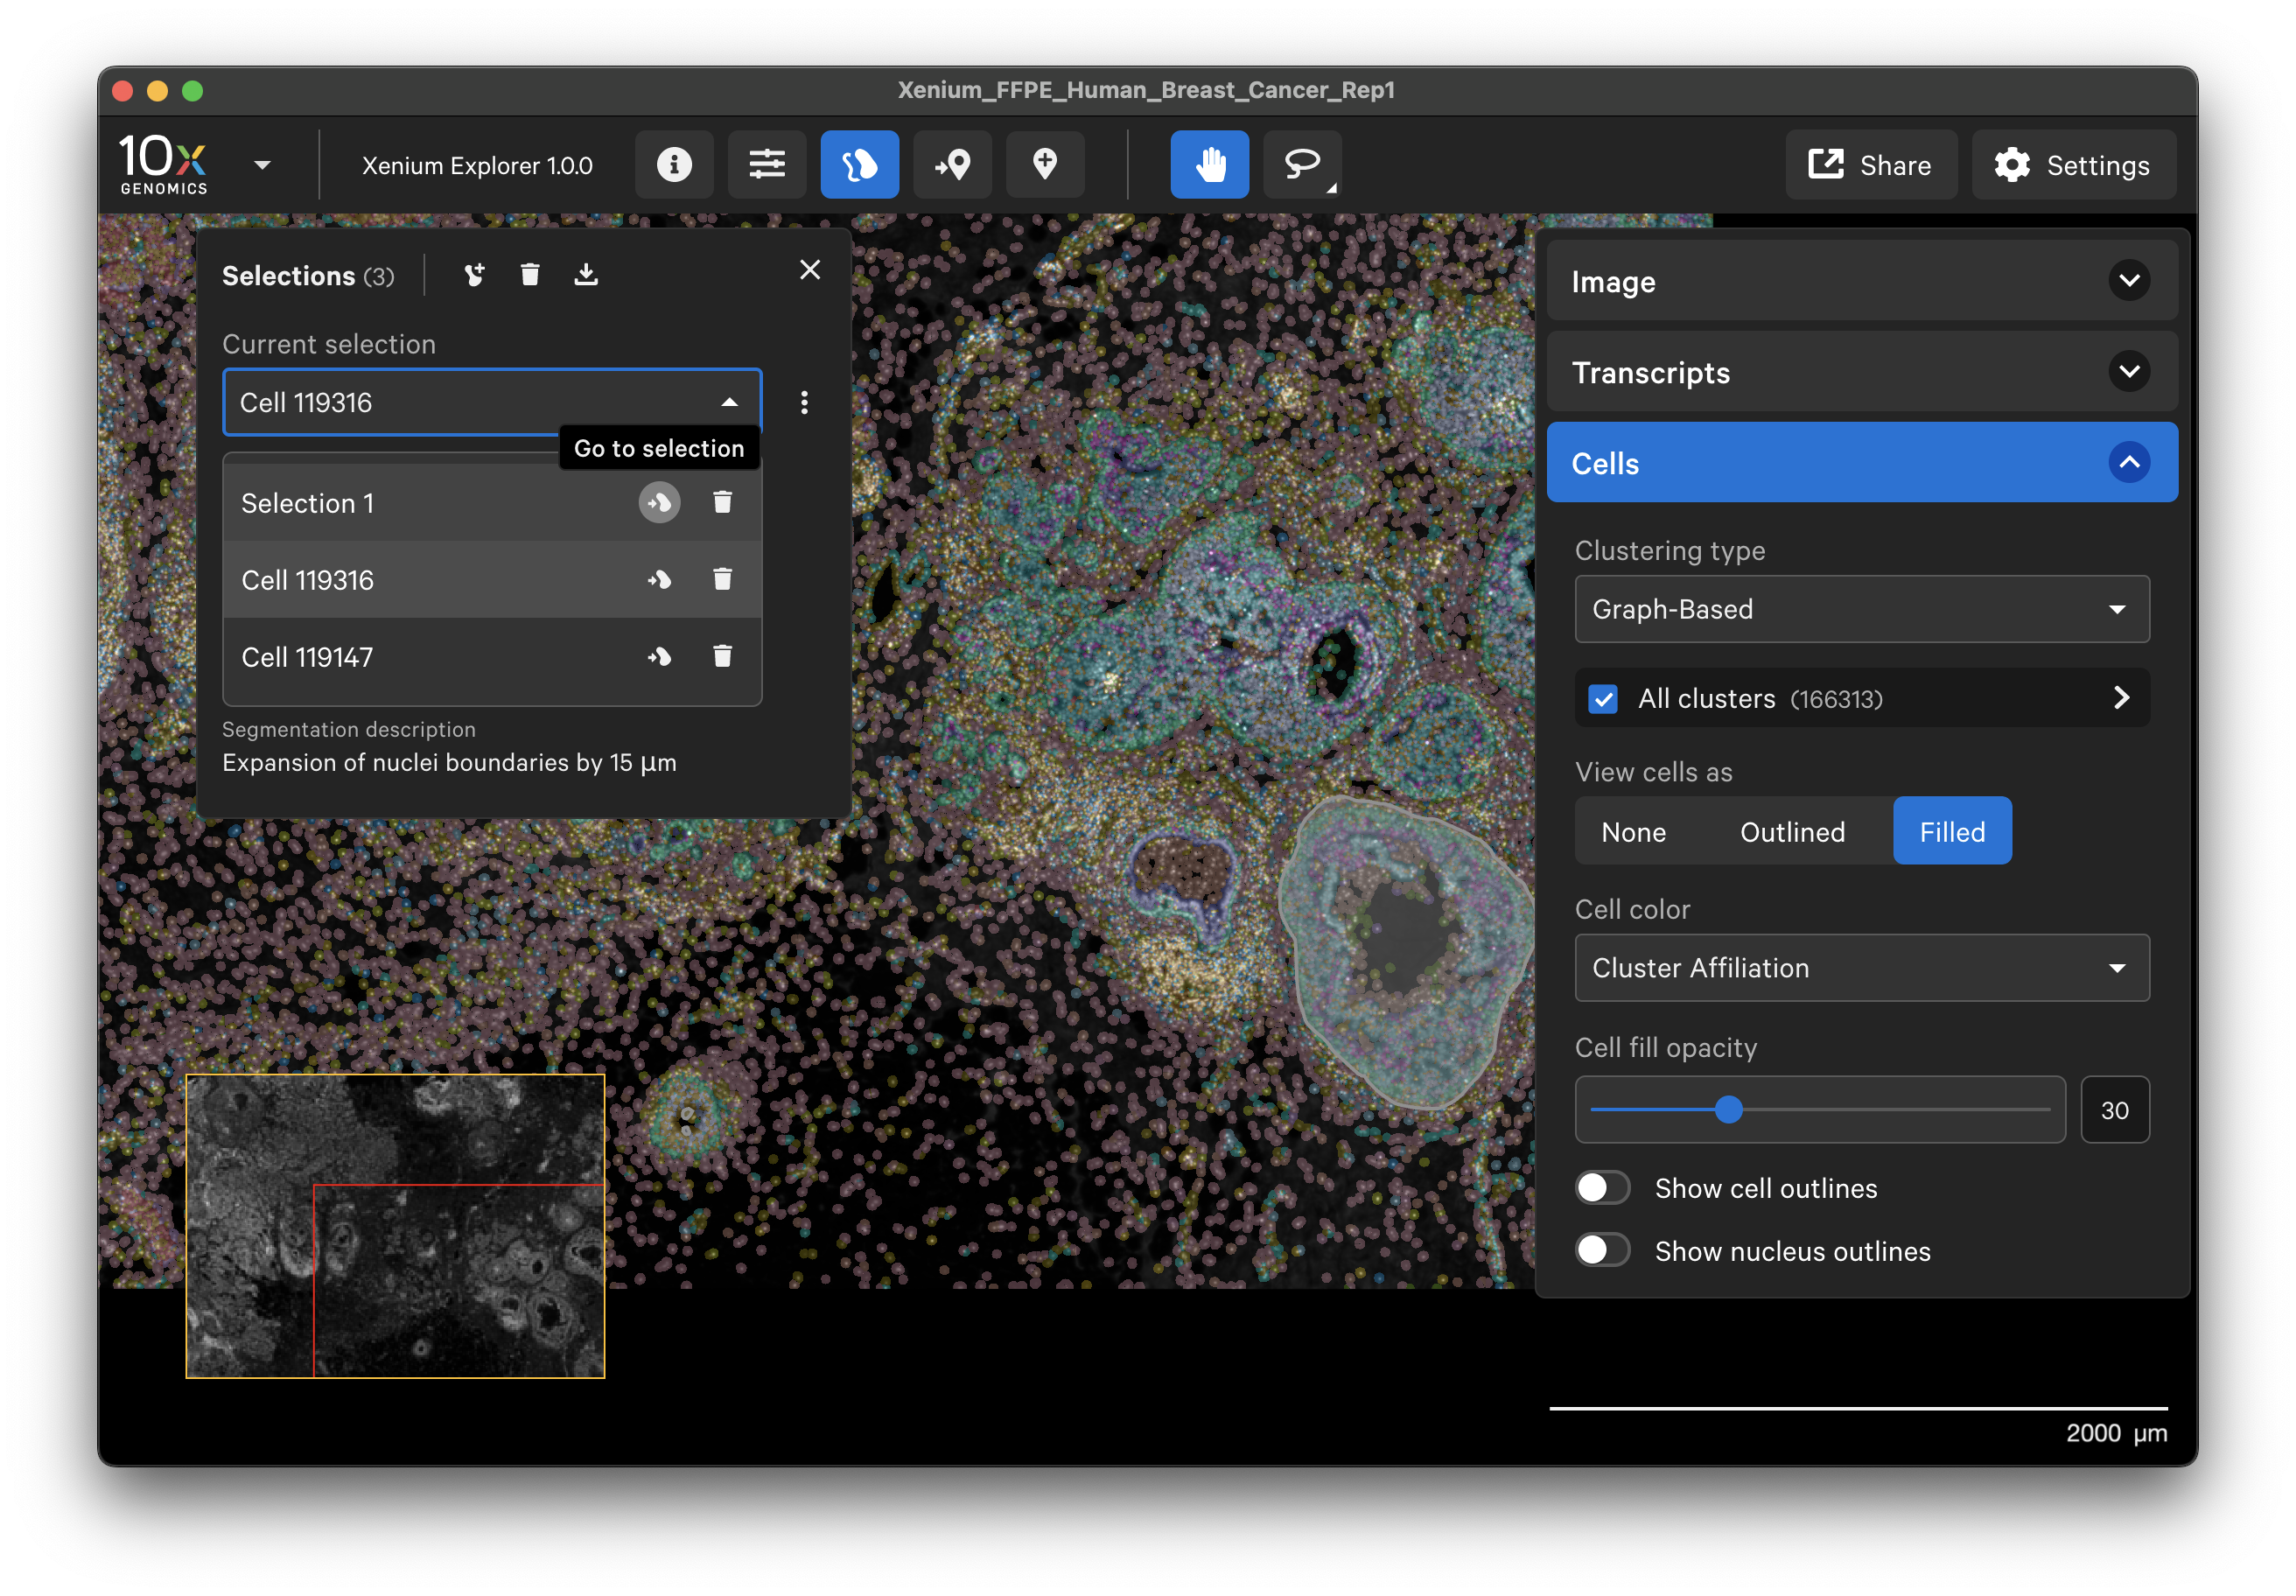
You can export selection coordinates, transcript stats, and cell stats from the Selections window.
Exporting selection coordinates
The download icon at the top of the Selections window allows you to export coordinates for all selected ROIs and cells to a CSV file.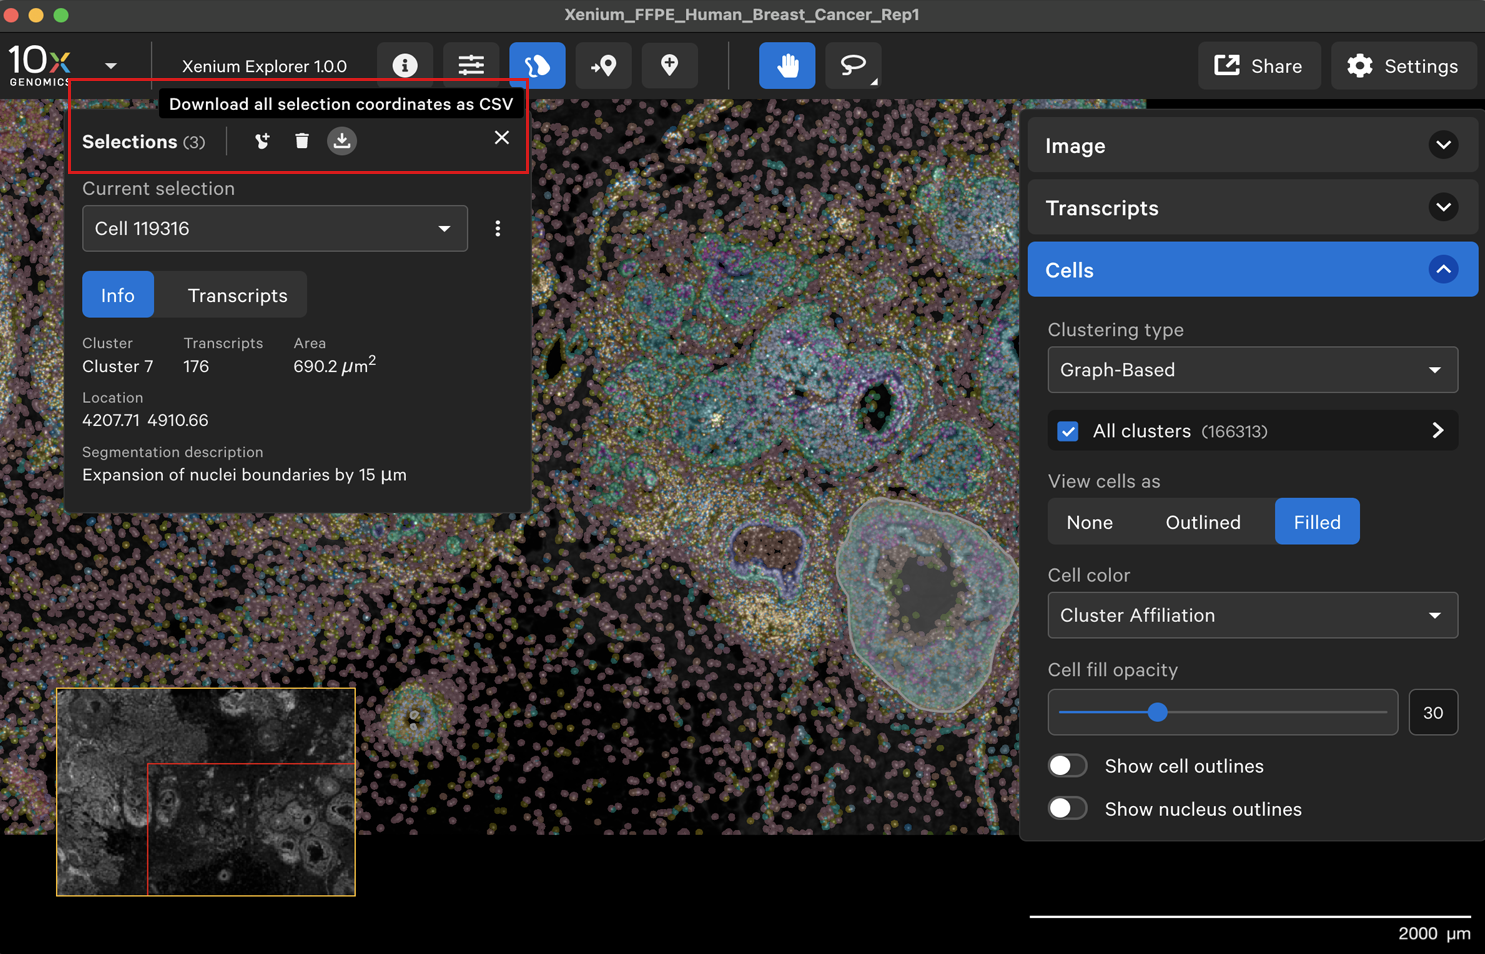
Here’s an example - the header lists the selected ROI and cell ID names:
"#Selection names: Selection 1, Cell 119316, Cell 119147"
"#Areas (µm^2): 600086.45, 690.23, 349.78"
Selection,X,Y
Selection 1,6185.80,4037.25
Selection 1,6183.51,4008.78
Selection 1,6183.51,4005.72
[ … ]
Cell 119316,4211.52,4894.30
Cell 119316,4202.15,4896.61
[ … ]
Cell 119147,4203.81,4954.44
Cell 119147,4199.60,4955.07
[ … ]
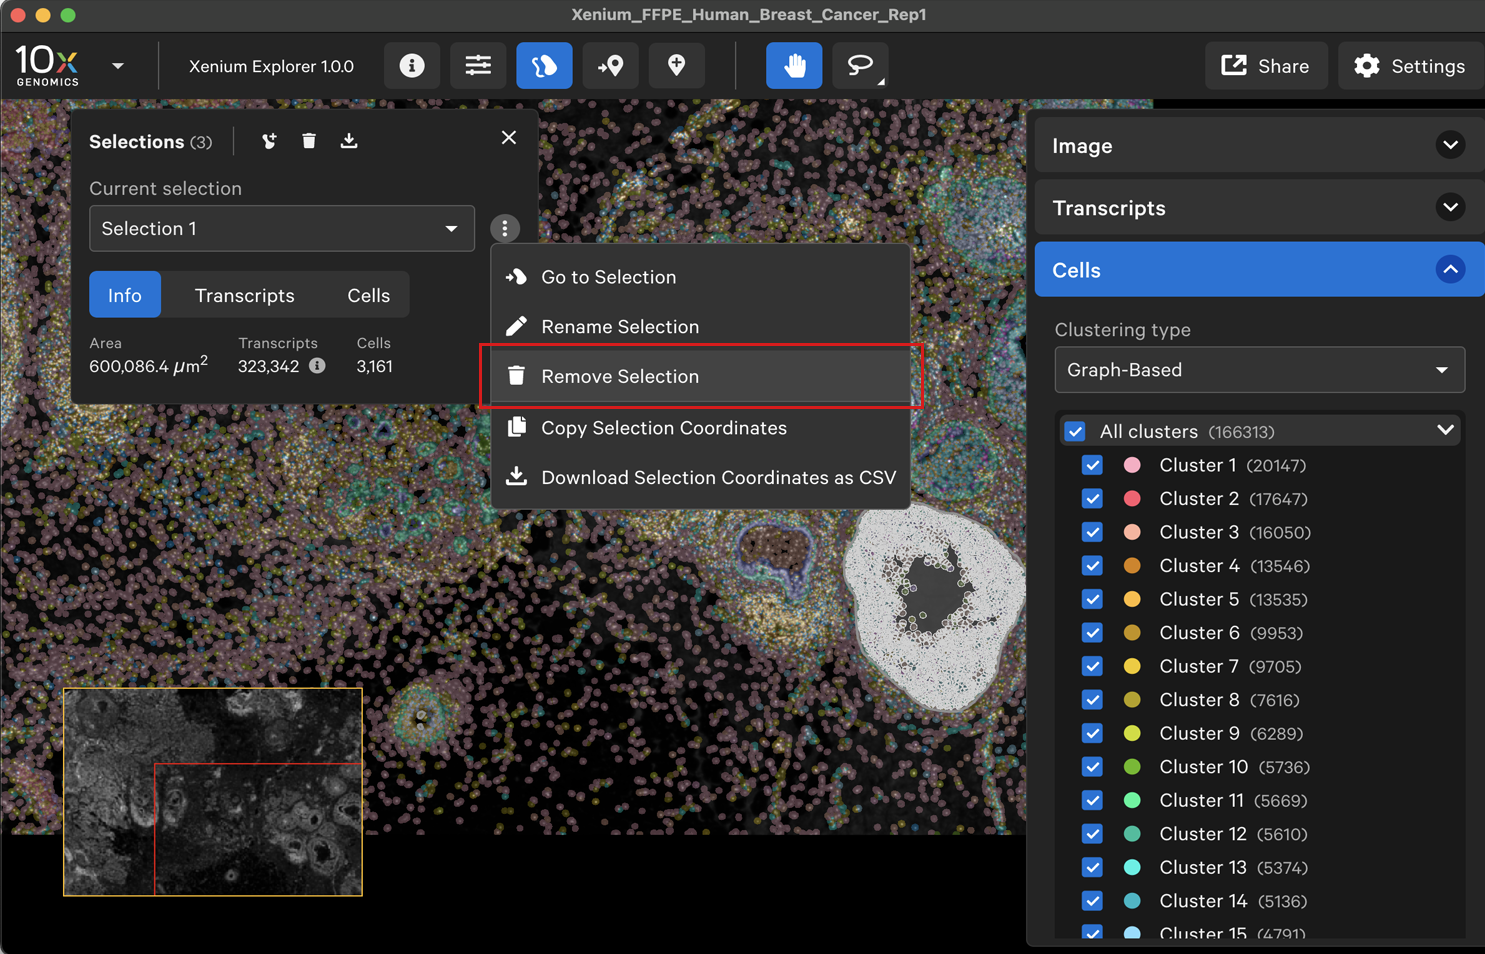
You can also export coordinates for a specific selection. Click the three dots next to the drop-down menu and either Copy Selection Coordinates or Download Selection Coordinates as CSV. 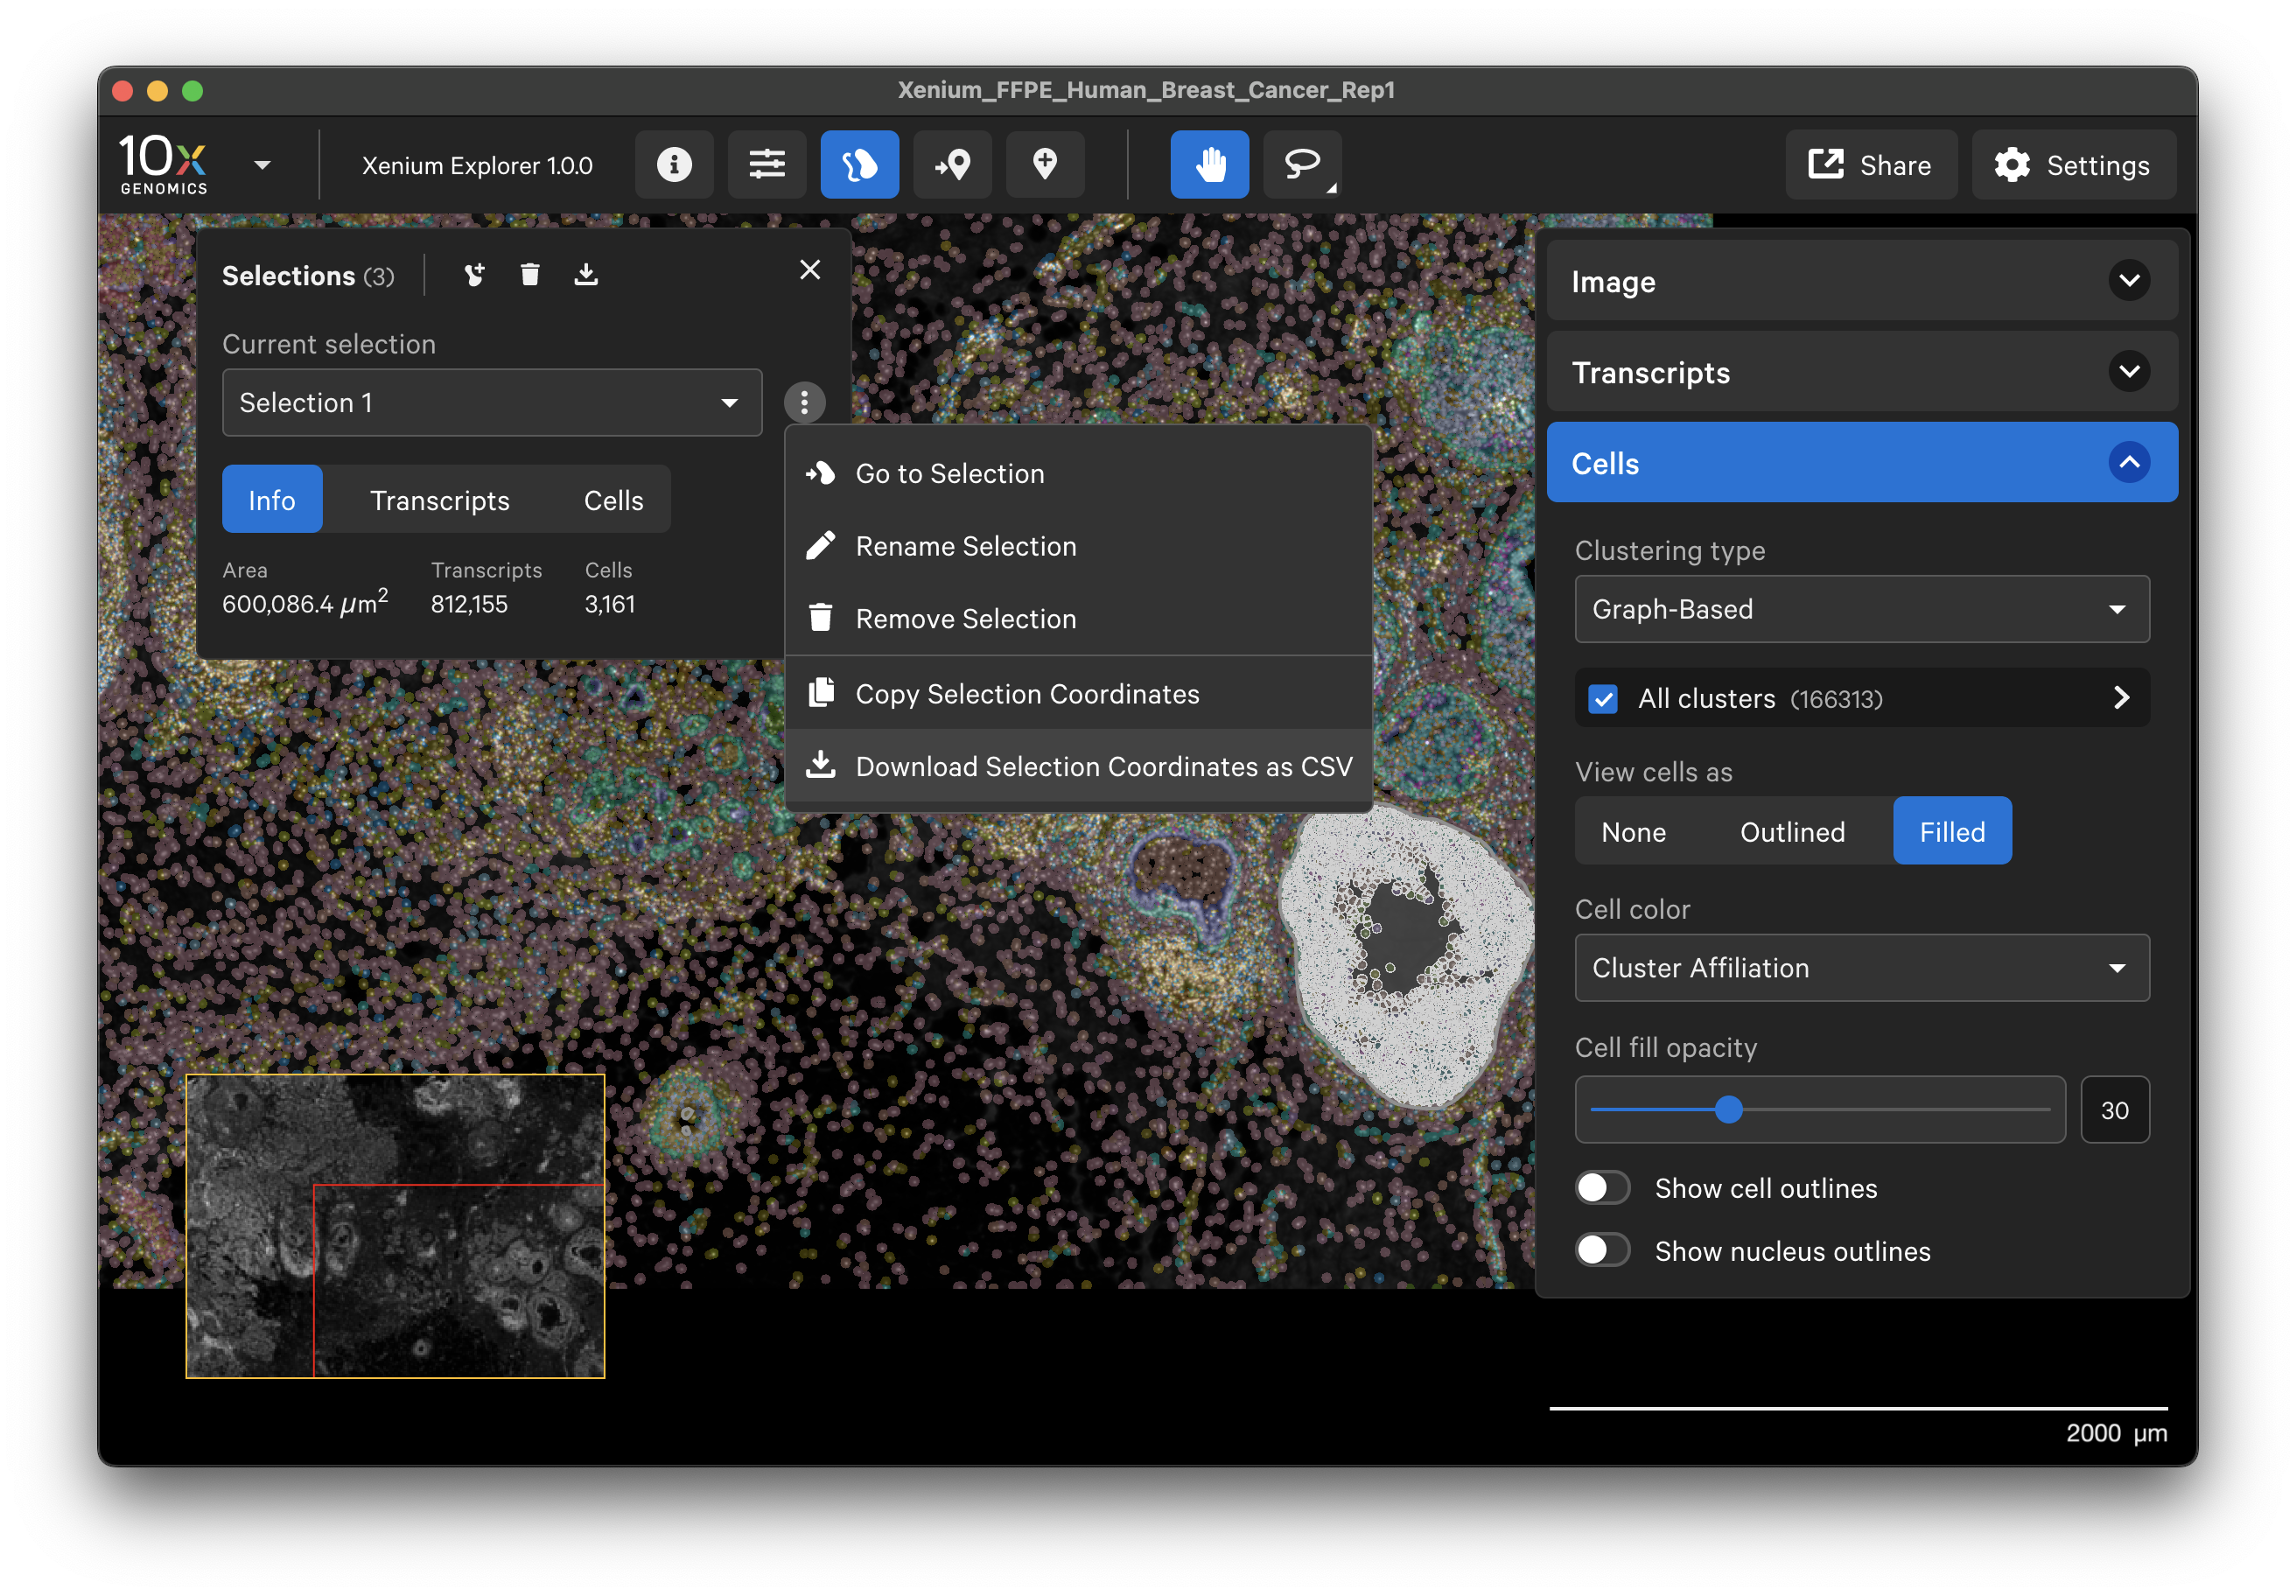
Example:
#Selection name: Selection 1
#Area (µm^2): 600086.45
X,Y
6185.80,4037.25
6183.51,4008.78
6183.51,4005.72
6187.52,3992.27
6191.96,3983.46
[ ... ]
Exporting selection transcript information
Click the three vertical dots on the Transcripts tab to copy or download a CSV file of transcript stat information.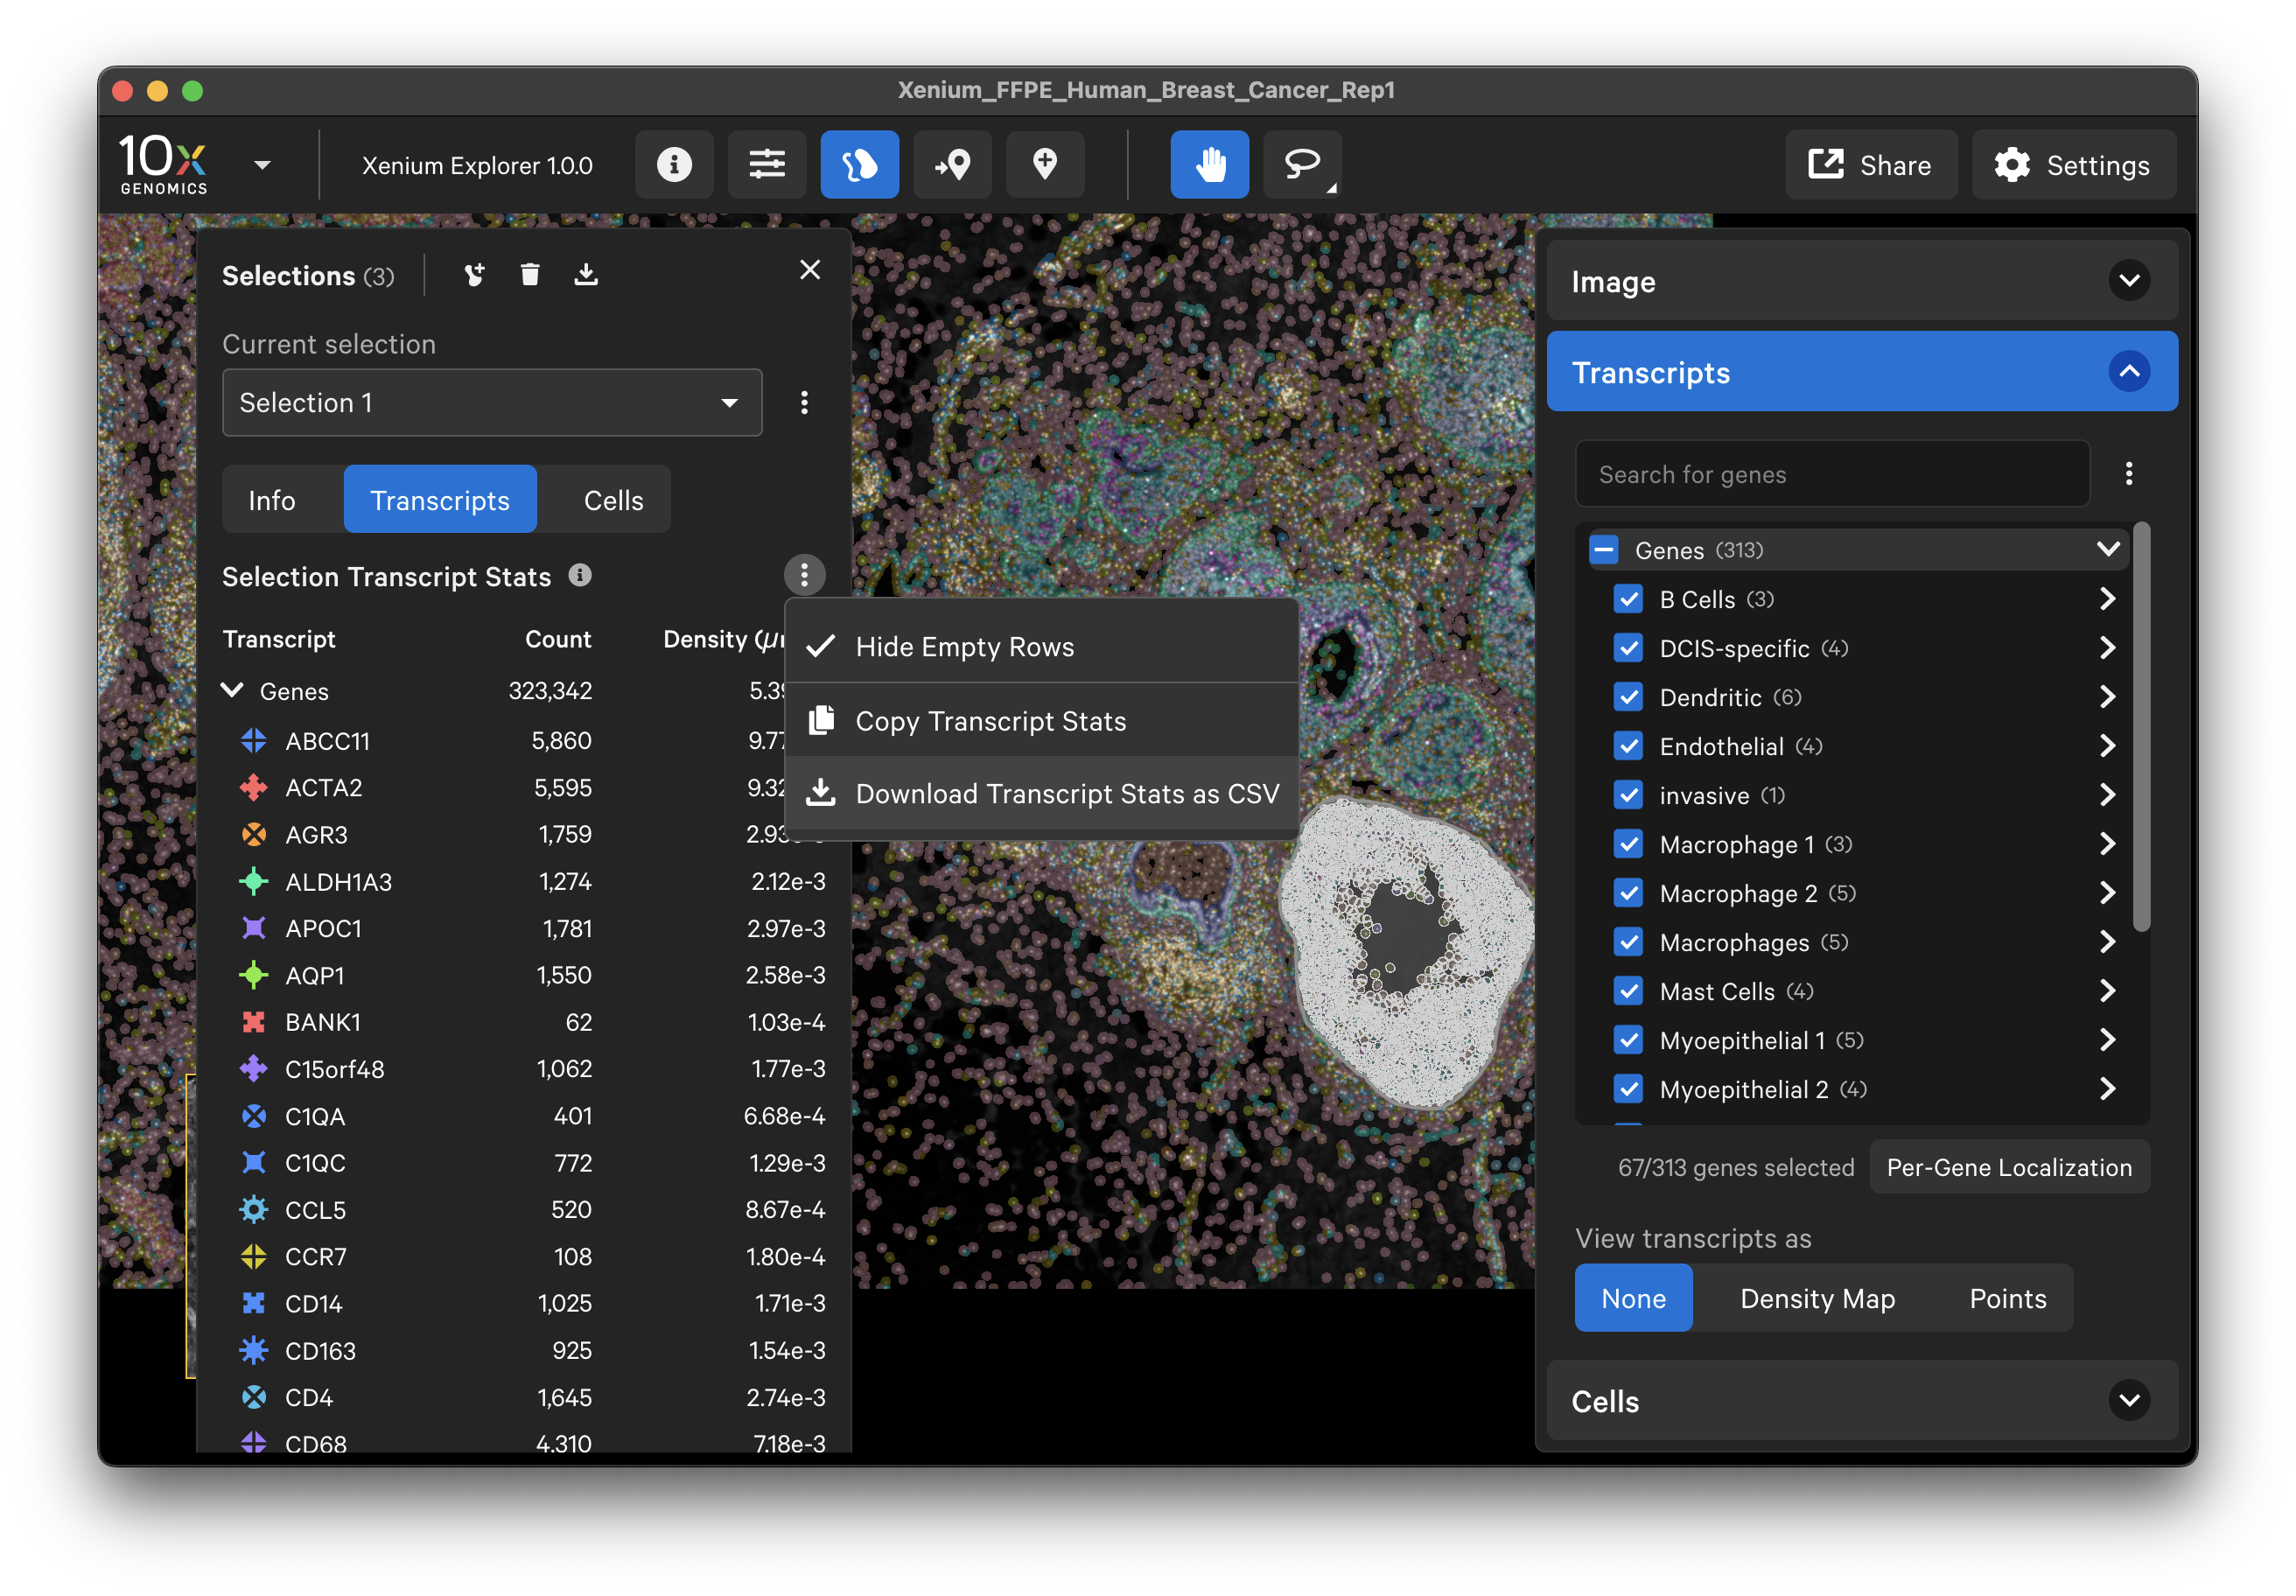 Example: (List of panel genes not included shortened)
#Selection name: Selection 1
#Area (µm^2): 600086.45
#Panel genes not included: ACTG2, ADAM9, ADGRE5, ADH1B, ADIPOQ, AHSP, AIF1, [...]
Gene,Count,Density (µm^-2)
ABCC11,5860,0.009765259709755862
ACTA2,5595,0.009323656668273728
AGR3,1759,0.0029312443394983894
ALDH1A3,1274,0.002123027452257503
APOC1,1781,0.0029679057240742644
[ ... ]
Exporting selection cell information
Click the three vertical dots on the Cells tab to copy or download a CSV file of cell stat information.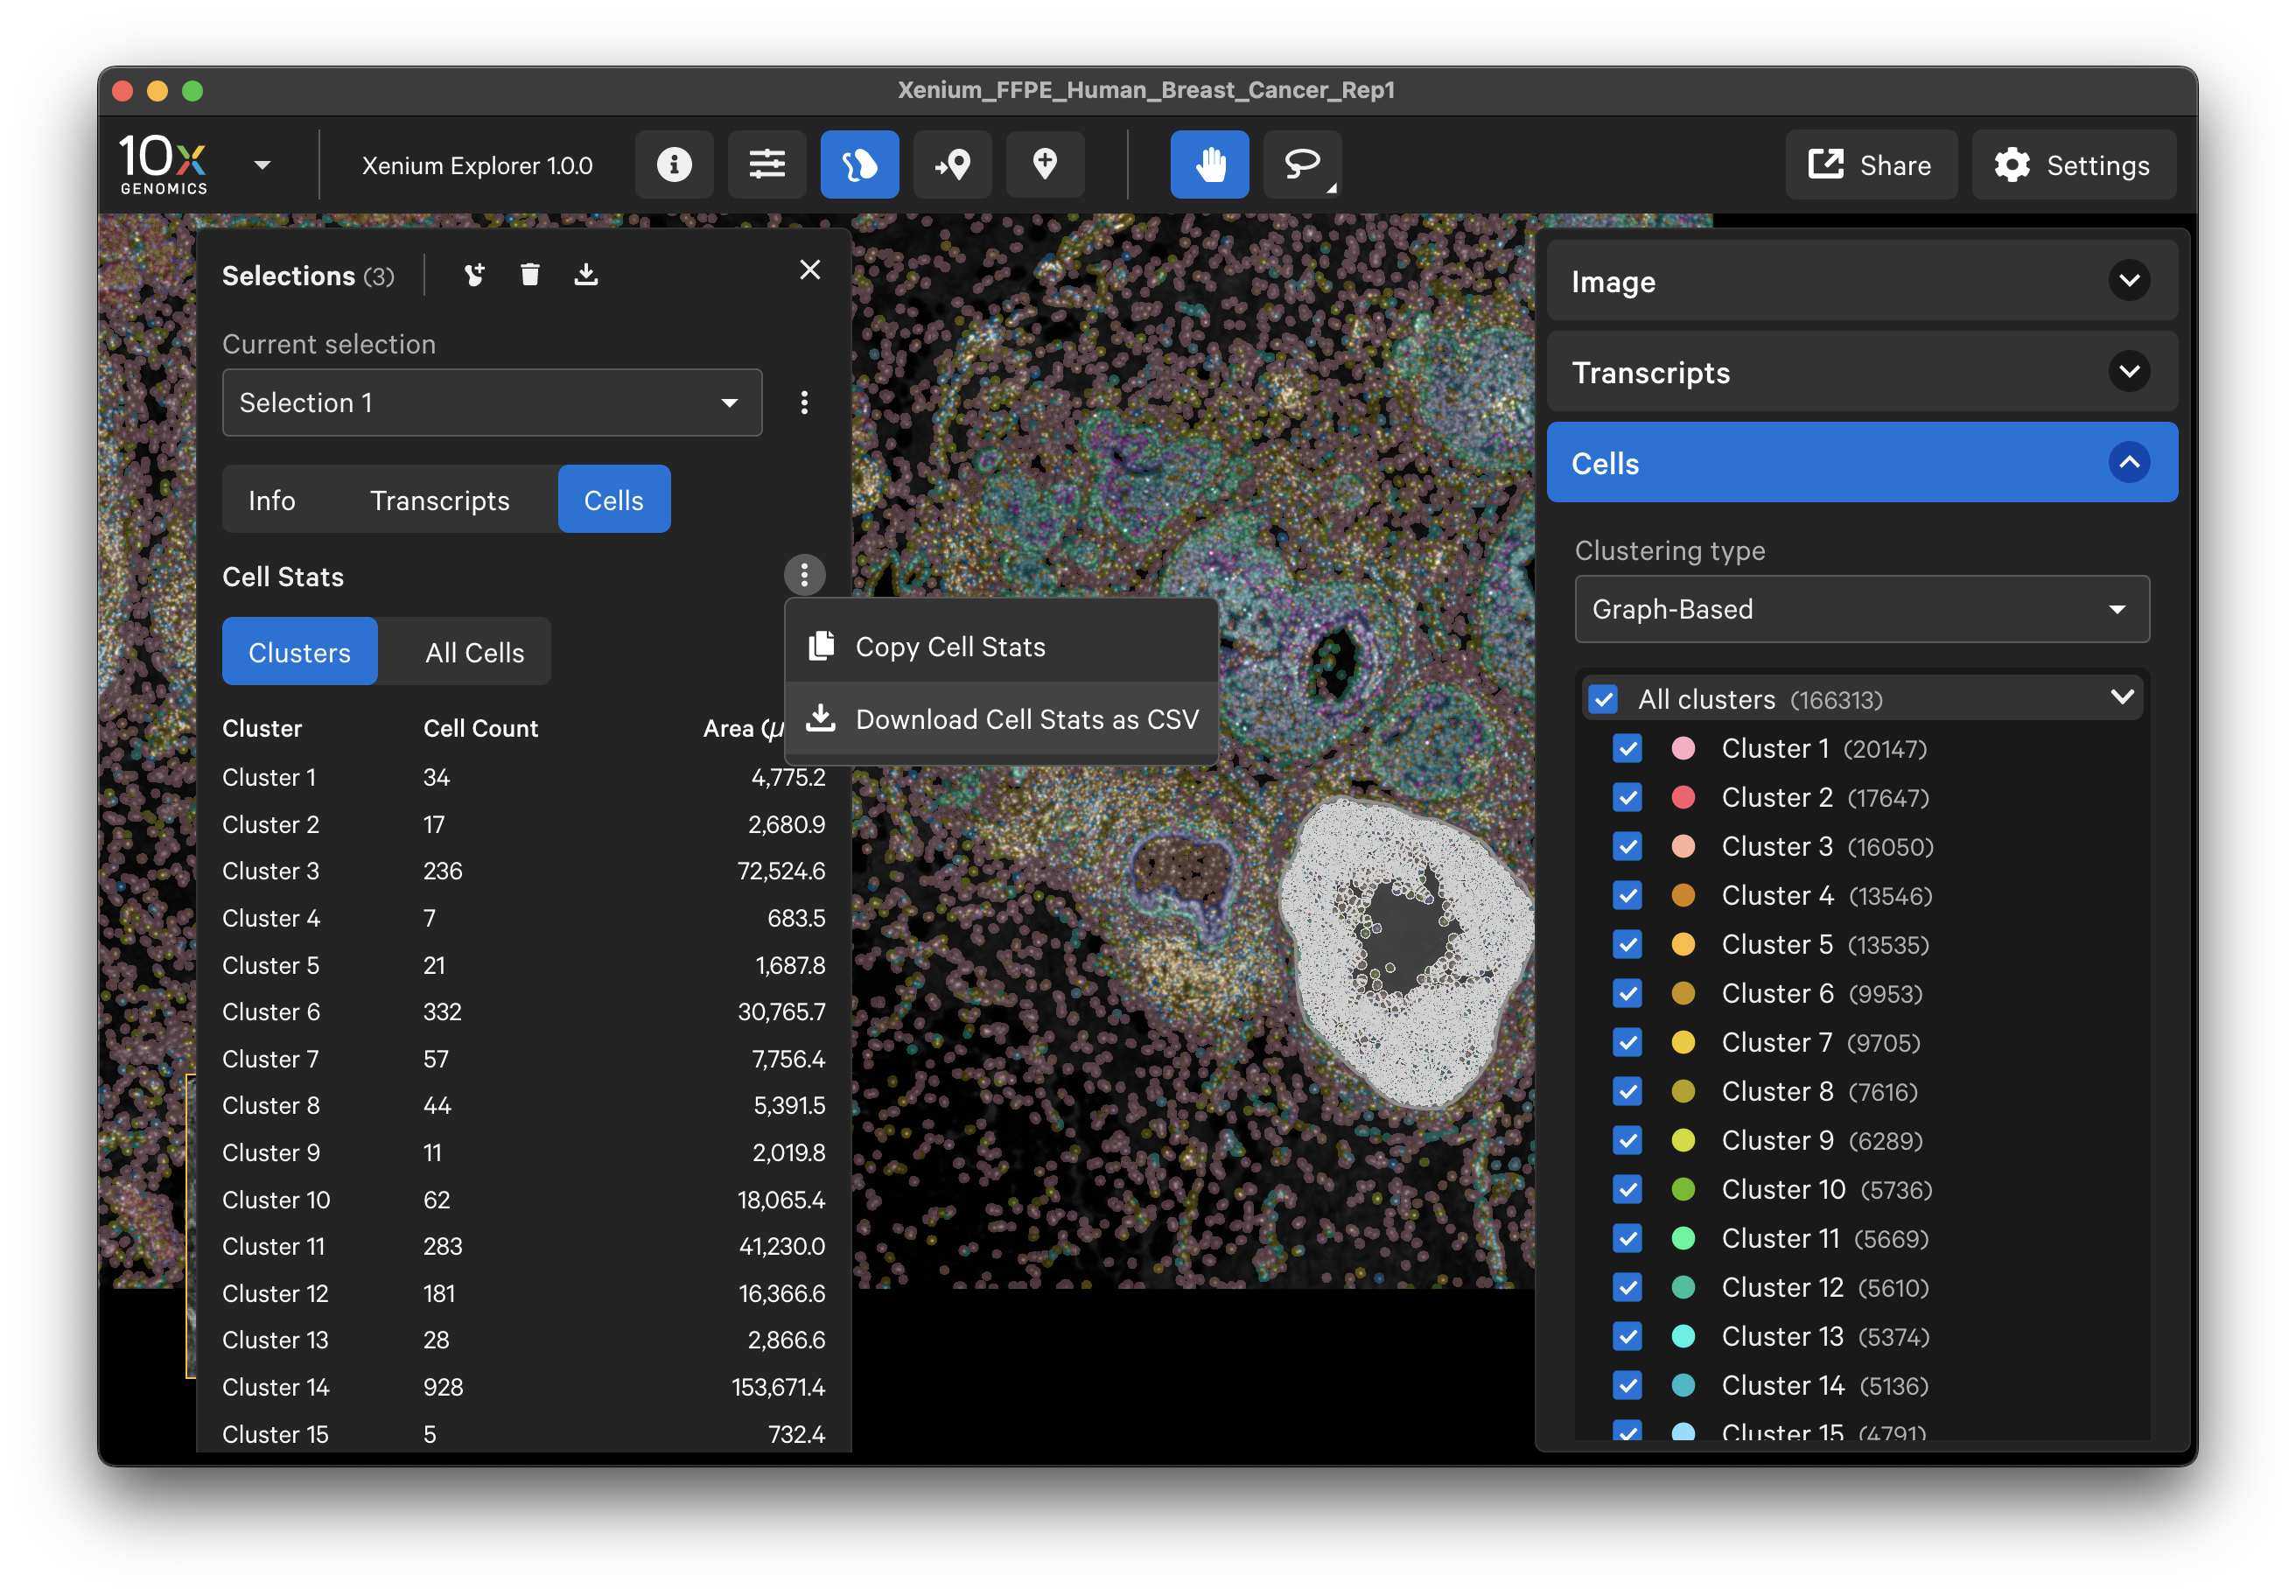 Example:
#Selection name: Selection 1
#Area (µm^2): 600086.45
"#Clusters not included: "
Cluster,Count,Area (µm^2)
Cluster 1,34,4775.16
Cluster 2,17,2680.88
[...]
Selections can be saved with the Save Current View function. Learn more in the Saving and Sharing Results tutorial.
You can also copy the selection lasso shape or cell coordinates from the Selections window and paste with the Lasso > Paste coordinates button. The copied coordinates will not be displayed on the screen, but the Selections window will then re-display information for the selected region. 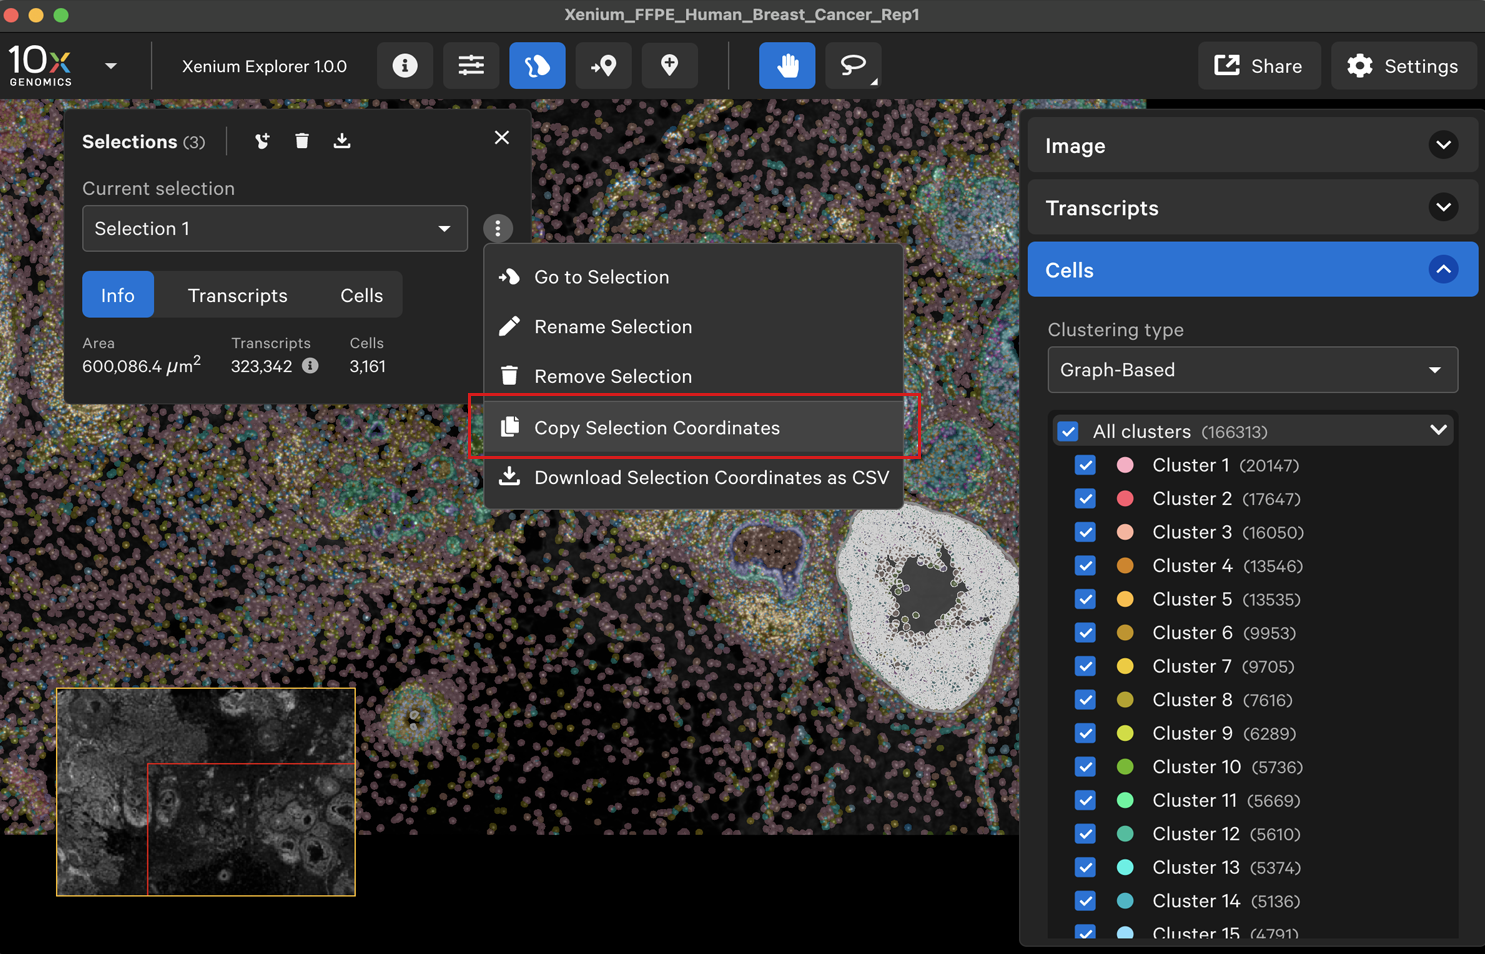
To test, you can open a new Xenium Explorer window (File > New Window) and paste the selection coordinates. The first selection in this new window now displays the same ROI information that was created above (including Transcripts and Cells tab information for whichever genes and/or cell clusters are checked in their respective menus). 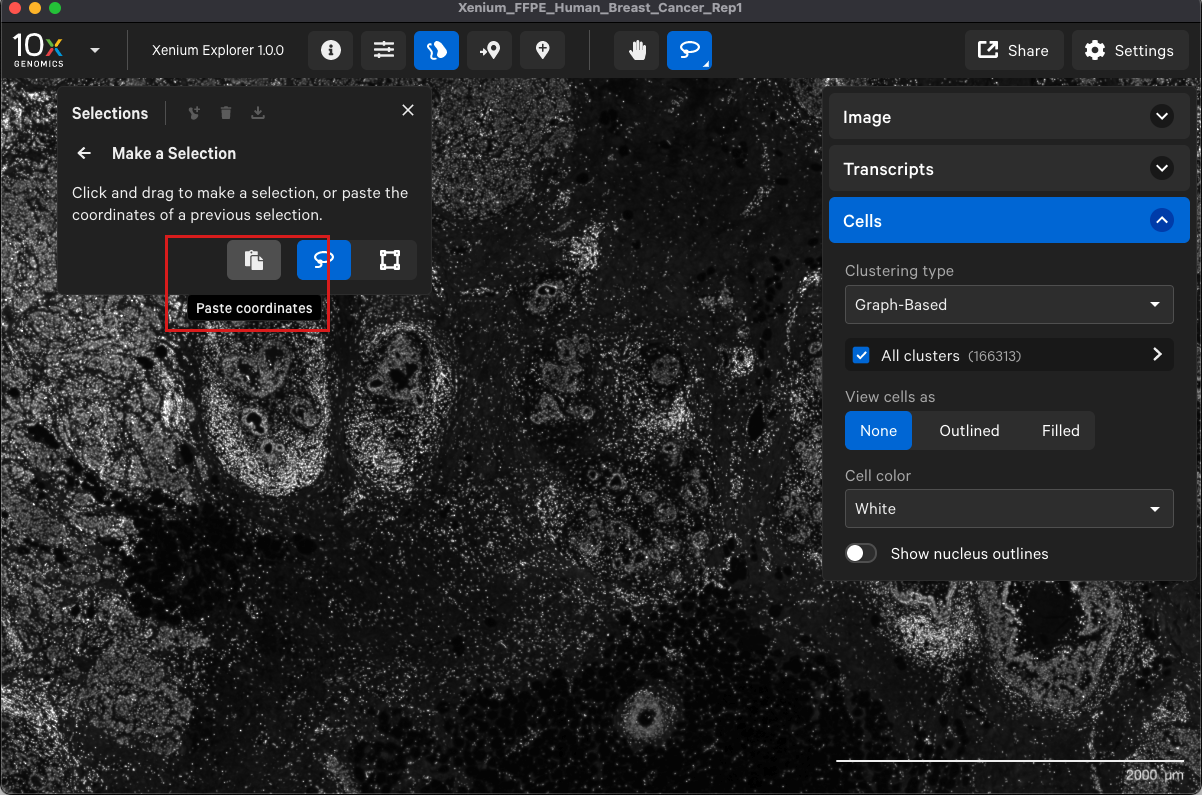
To delete all selections, click the trash can icon at the top of the Selections window.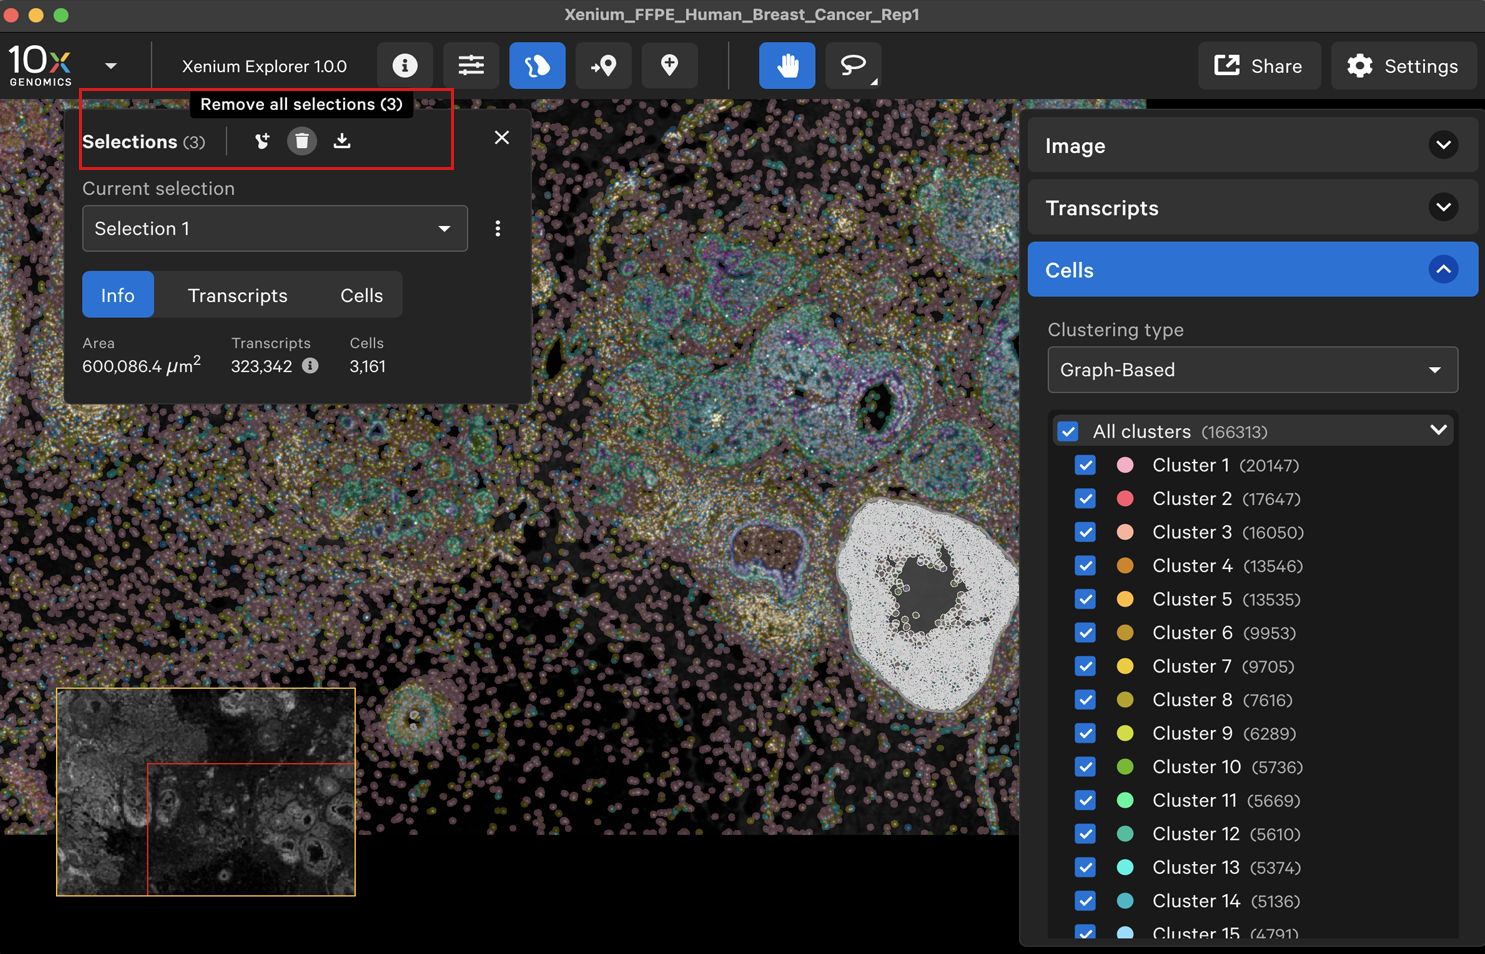
There are two ways to delete specific selections:
- Click the three dots next to the drop-down menu and click Remove Selection.
- Click the trash can icon in the drop-down menu.
